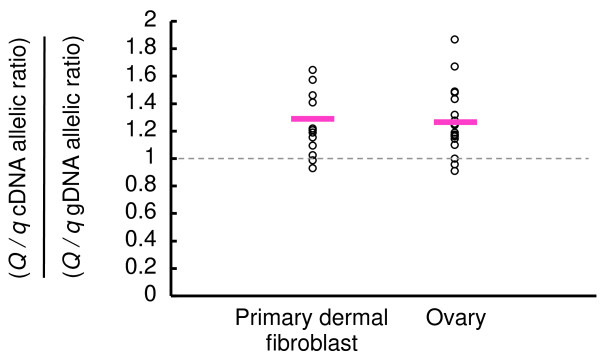
Figure 4.

The allelic imbalance test for levels of GTF2F2 mRNA in the heterozygotes. The cDNA from primary dermal fibroblasts and ovaries and genomic (g) DNA from heterozygous animals was amplified using primers to BovineHD1200004611 (15,465,327 bp) on BTA12, which is located in the exon of GTF2F2 (Additional files 3 and 5). The PCR product was directly sequenced. Peak height at the SNP was quantified using PeakPicker 2 software [8]. The y-axis shows the ratio of the ratios of the peak height of the Q allele over the q allele in the cDNA and in the gDNA from the same animal. Red bars show the mean expression in primary dermal fibroblasts (n = 13, mean = 1.336) and ovaries (n =19, mean = 1.325). The P values for the difference between the ratios of the peak height of the Q allele over the q allele in the cDNA and the ratios of the peak height of the Q allele over the q allele in the gDNA were 0.002 (primary dermal fibroblast) and 0.0011 (ovary), respectively, as determined by t-test.
