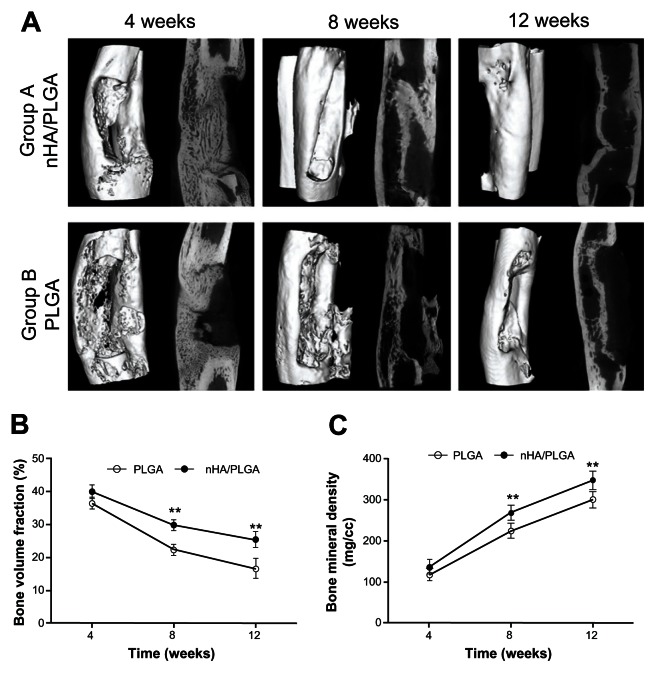
Figure 5.
Micro-CT images and analysis of new bone formation. (A) Porotic stage was displayed on the 4th week images in both groups. In the 8th week, images of Group A reveal the beginnings of cortical bone formation. Good cortical bone formation was displayed on images from the 12th week in Group A. The virgin PLGA scaffold (Group B) did not form a whole bone cortex. (B) The ratio of bone volume/total volume (%) in indicated groups and time points. **P < 0.01, compared to another group at the same time point. (C) The bone mineral density in each group compared to another group at the same time point. **P < 0.01, compared to another group at the same time point.
Abbreviations: nHA, nano-hydroxyapatite; PLGA, poly (lactic-co-glycolic acid).

