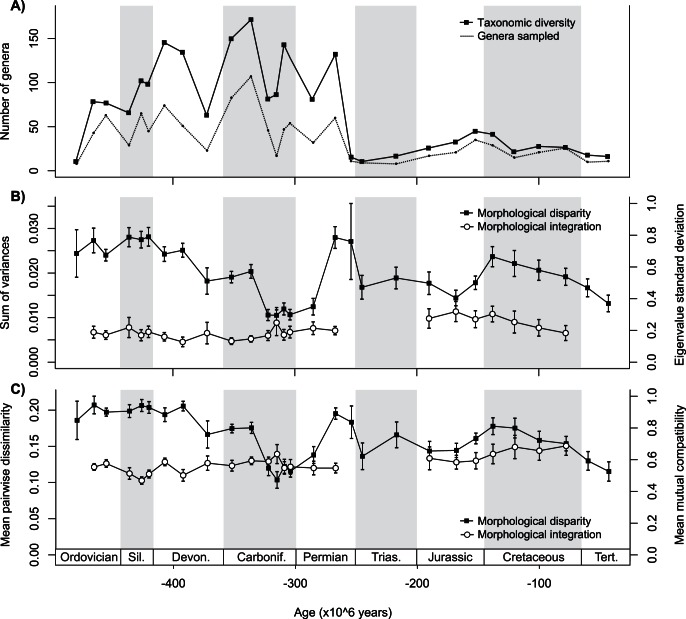
Figure 1. The temporal trajectories of taxonomic diversity, morphological disparity and morphological integration of Phanerozoic crinoids.
(A) Number of genera known and number of species sampled per genus per stratigraphic interval. (B) Disparity measured as the sum of univariate variances; integration measured as the relative standard deviation of the eigenvalues of the correlation matrix. (C) Disparity measured as the mean character dissimilarity; integration measured as mean mutual compatibility. Error bars are bootstrapped standard errors. Because low sample sizes prevent from deriving reliable estimates of correlation matrices (see text), integration values are not presented for Early Ordovician, Late Permian, Triassic, and Cenozoic data. Whether based on the analysis of discrete or continuous variables, variations in the overall degree of integration do not appear to be associated with concomitant changes in disparity.

