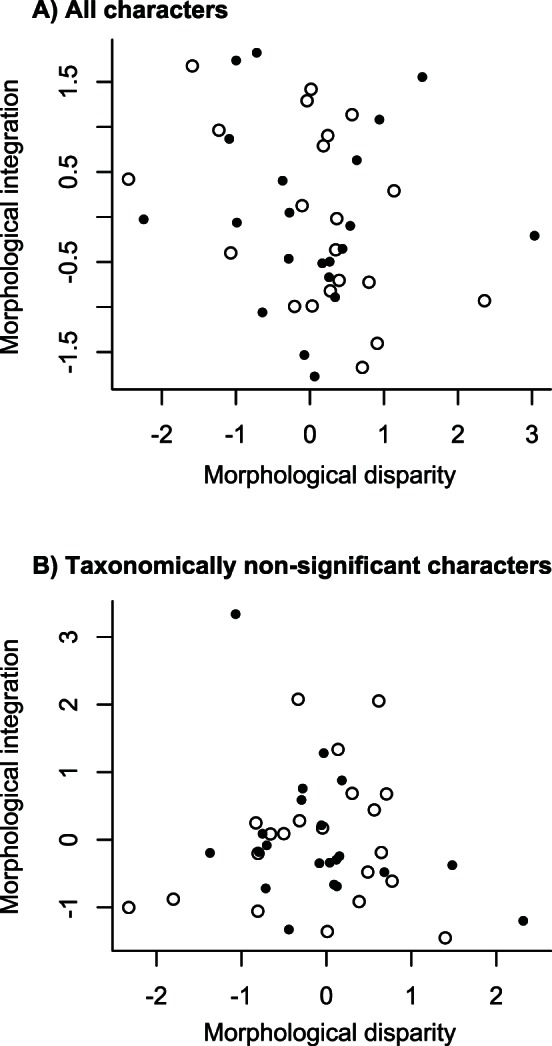
Figure 2. Correlation between temporal changes in disparity and integration.

Spearmann’s rank correlation between level of morphological disparity and degree of morphological integration. (A) Generalized differences of morphological integration versus disparity for the PCoA-based approach (black circles; r = −0.118, P = 0.609) and the discrete character approach (open circles; r = −0.449, P = 0.042) when all characters are considered. (B) Generalized differences of morphological integration versus disparity for the PCoA-based approach (black circles; r = −0.340, P = 0.131) and the discrete character approach (open circles; r = 0.118, P = 0.609) when only taxonomically non-significant characters are considered (see text). In general, the amount of morphological disparity displayed by crinoids is not significantly correlated with the overall degree of integration among morphological traits.
