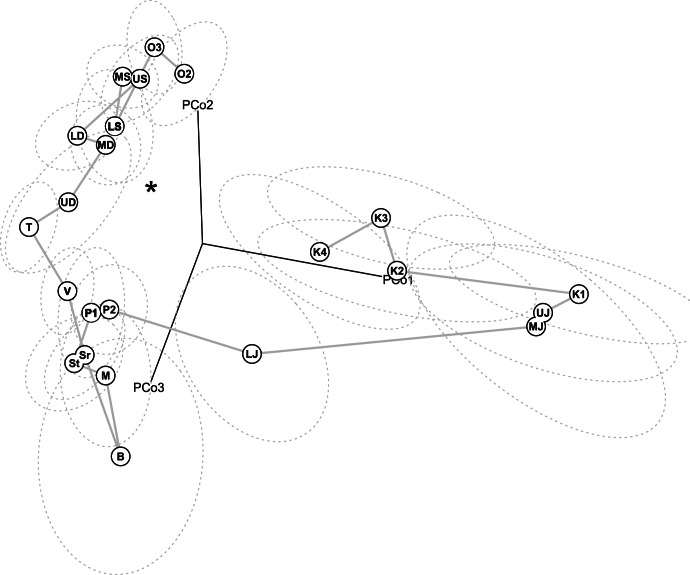
Figure 3. The temporal trajectory of integration patterns of Phanerozoic crinoids.
The plot shows the first three principal coordinates of the space of correlation matrices. Each point corresponds to the correlation matrix of crinoids within a given geologic time interval (The correlation between pairwise Euclidean distances in the space of the first three principal coordinates and the actual distances between correlation matrices is 0.85). The grey line represents the temporal trajectory of correlation matrices from the Ordovician (O2) to the end of the Cretaceous (K4), and the asterisk gives the location of the identity matrix (i.e., a matrix with no integration among traits). Dotted lines are 68% confidence ellipses based on bootstrap resampling. Labels: O2 = Llanvirnian to lower Caradocian, O3 = remainder of Ordovician, LS = Lower Silurian, MS = Middle Silurian, US = Upper Silurian, LD = Lower Devonian, MD = Middle Devonian, UD = Upper Devonian, T = Tournaisian (Carboniferous, Mississippian), Sr = Serpukhovian (Carboniferous, Mississippian), B = Bashkirian (Carboniferous, Pennsylvanian), M = Moscovian (Carboniferous, Pennsylvanian), St = Stephanian (Carboniferous, Pennsylvanian), P1 = Asselian-Sakmarian (Permian), P2 = Artinskian-Kungurian (Permian), LJ = Lower Jurassic, MJ = Middle Jurassic, UJ = Upper Jurassic, K1 = Neocomian (Cretaceous), K2 = Barremian-Aptian (Cretaceous), K3 = Albian-Turonian (Cretaceous), K4 = Senonian (Cretaceous). The first principal coordinate separates Palaeozoic from post-Palaeozoic forms. The distribution of most Palaeozoic correlation matrices near the identity matrix emphasizes their homogeneous structure (roughly similar pairwise correlation among traits), whereas post-Palaeozoic correlation matrices display individuated blocks of correlated traits.

