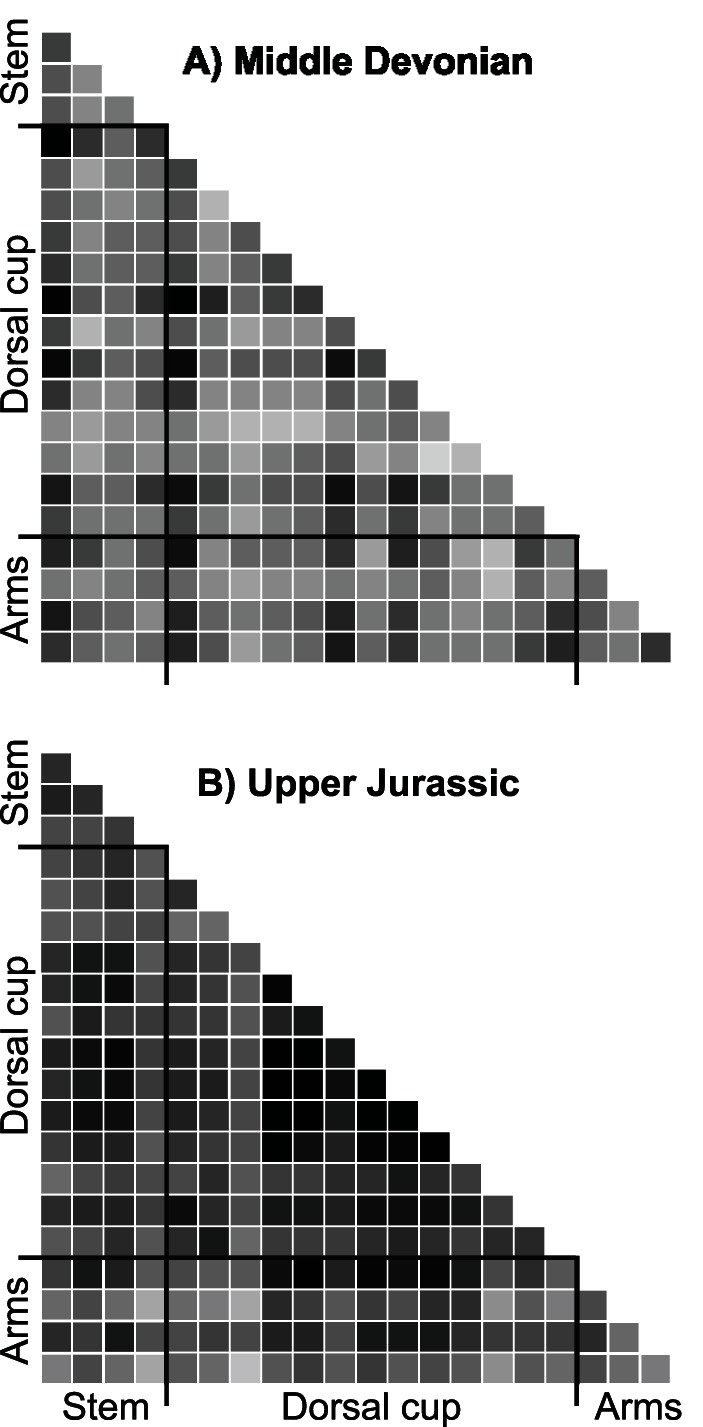
Figure 4. Matrices of mutual compatibility for Palaeozoic and post-Palaeozoic crinoids.

These two matrices exemplify the differences in patterns of integration between (A) Palaeozoic (Middle Devonian, MD) and (B) post-Palaeozoic crinoids (Upper-Jurassic, UJ). The choice for these two time intervals has been driven by their location in the space of correlation matrix (separation along PCo1; see Figure 3) and the comparability of their sets of applicable characters (number and distribution over the whole character matrix). The gray-scale correlates with the strength of mutual compatibility (∼correlation): the darker the gray, the higher the compatibility. The comparison of these two matrices shows the overall stronger integration among characters within the post-Palaeozoic matrix and its heterogeneous structure with larger blocks of compatible characters (e.g., stem and dorsal cup characters, arm and dorsal cup characters).
