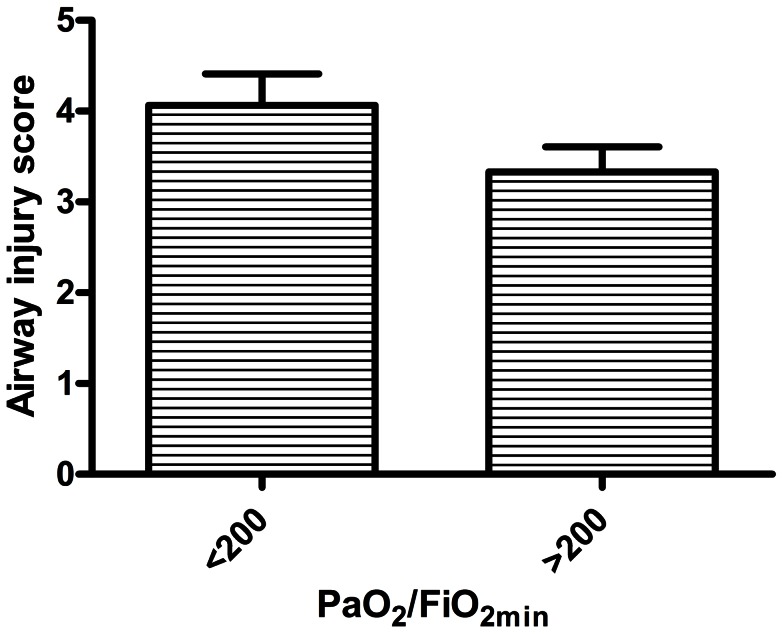
Figure 1. Comparison of airway injury score (graded for soot, inflammation, epithelial sloughing and secretions at <72 hr post injury), between patients with the lowest PaO2/FiO2 ratios during the first 2 weeks post injury (PaO2/FiO2) of <200 (N = 16), and patients with PaO2/FiO2 ≥200 (N = 24).
Bars represent mean ± SE. P = 0.11, t-test with Welch's correction for unequal variances.

