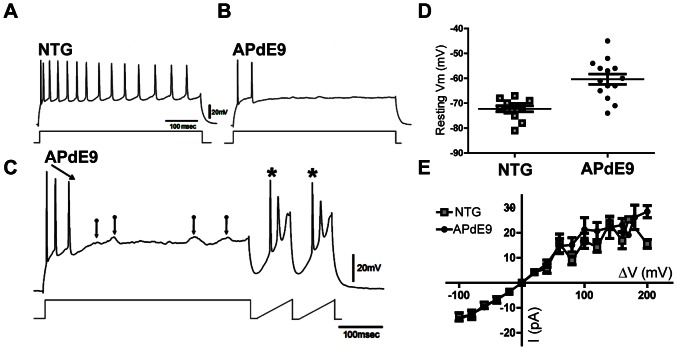
Figure 4. Inhibitory DG Cells Fail to ‘Spike’.
Examples of electrical recordings from NTG and APDE9 inhibitory interneurons. (A) NTG interneuron membrane responses following positive current injection. (B) When depolarized incrementally, APdE9 interneurons showed dramatic failures at producing continuous trains of action potentials. (C) In some instances the spikes could be recovered (*) with hyper-polarization following the depolarizing current injections, indicating a possible channelopathy. (D) Interneuron resting membrane potentials (Vm) in NTG (open squares) and APdE9 (filled circles) tissues were significantly different (NTG: Vm = −72.73±1.176 N = 11; APdE9: Vm = −60.36±2.082 N = 14, p<0.0001, unpaired t-test). (E) Current vs. voltage plots, depicting passive membrane properties of the input resistance (Rin). Positive and negative square wave pulses were injected while the cells were held at −70 mV in a current clamp mode. Electrode resistance was bridge balanced and despite the difference in the Vm, Rins in NTG and APdE9 interneurons were not significantly different (p = 0.558, Welch's t-test, df = 30).

