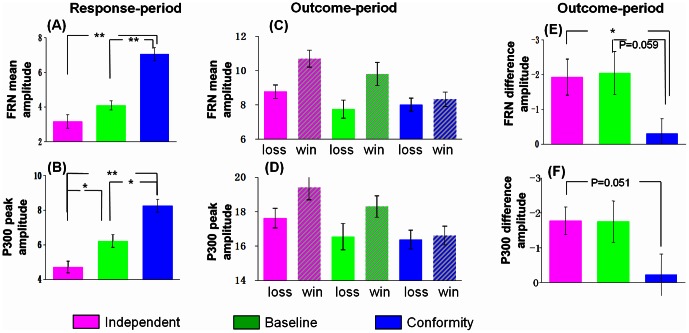
Figure 3. The amplitudes of the FRN and P300.
The FRN and P300 amplitudes (mean, SE) for three experimental conditions (Independent, Baseline vs. Conformity) (A&B) during response period and six experimental conditions (IL: choose to be different from others and actually loss; IW: choose to be different from others and actually win; BL: choose to conform to one of the confederate and actually loss; BW: choose to conform to one of the confederate and actually win; CL: choose to conform to others and actually loss; CW: choose to conform to others and actually win) (C&D) during outcome period, and the difference waveform for three conditions (independent loss-win, baseline loss-win, conformity loss-win) were shown (E&F). **p<0.01, *p<0.05.

