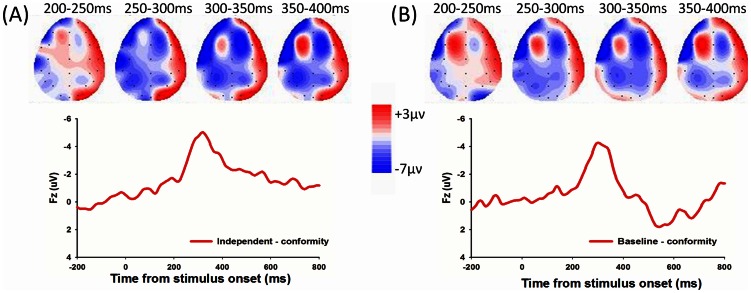
Figure 4. The FRN effect in the response period and topographical maps.
(A)The independent minus conformity difference waveform and corresponding topographical maps (200–400 ms, 50 ms interval) and (B) the baseline minus conformity difference waveform and corresponding topographical maps (200–400 ms, 50 ms interval) were shown.

