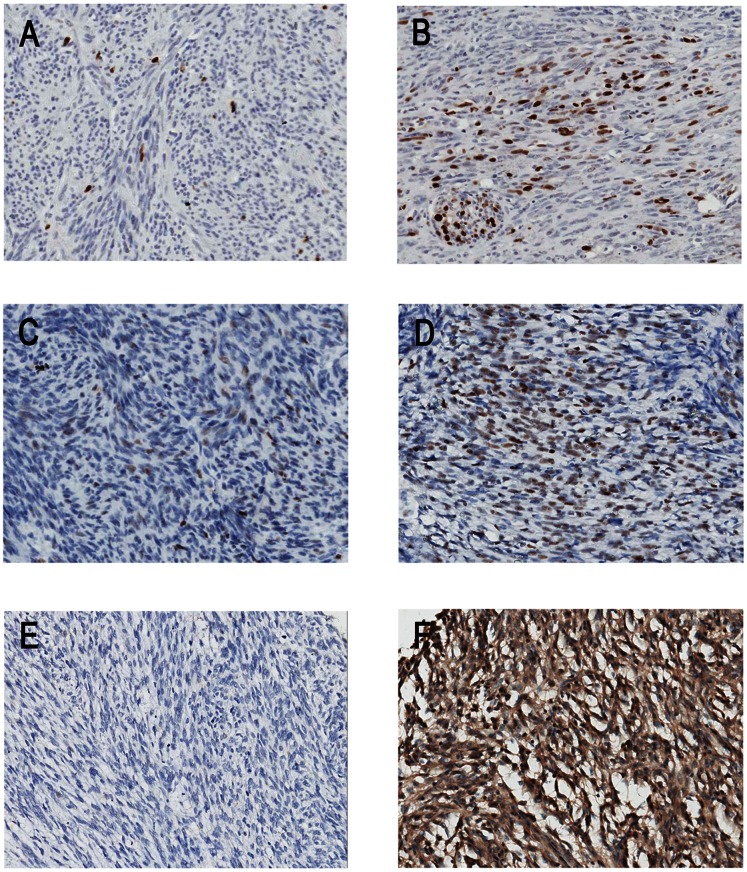
Figure 1. Representative examples of Ki67, p53, and SKP2 expression in GIST.
(A–B): Ki67 nuclei staining in 3% (A) and 20% (B) of cells on TMA slide. (C–D): p53 nuclei staining in 20% of cells with moderate intensity (C) and 40% of cells with strong intensity (D) on TMA slide. The index for C and D is 40 (40 = 2*20%*100) and 120 (120 = 3*40%*100), respectively. (E–F): Negative (<10%) (E) and positive (>10%) (F) SKP2 nuclei with cytoplasmic staining on TMA slide (×200).

