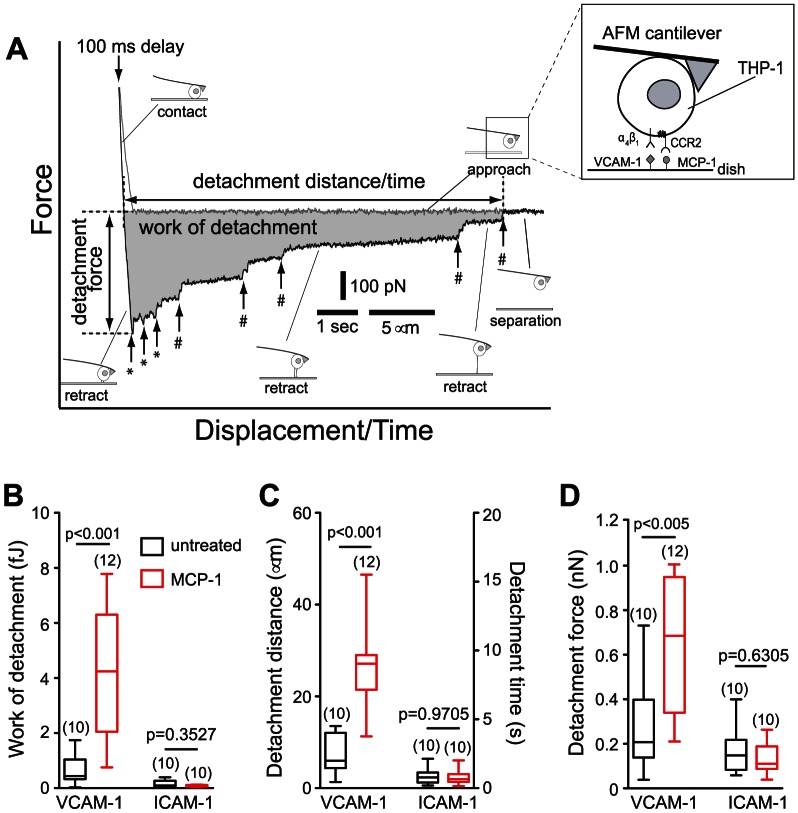
Figure 1. AFM measurement of THP-1 adhesion to immobilized adhesion molecules.
(A) AFM force-displacement curve of THP-1 adhesion to VCAM-1 co-immobilized with MCP-1. The approach (gray) and retract (black) traces of the AFM measurement are shown. Shaded area represents the work of detachment done by the cantilever to completely detach the cell from the substrate. Vertical arrows denote rupture events mediated by cytoskeleton-anchored (*) or membrane-tethered integrins (#). The inset is a representation of the experimental system. A flexible AFM cantilever was used to immobilize a THP-1 cell expressing α4β1 and LFA-1 integrins and CCR-2 receptors of MCP-1, which was coimmobilized with ICAM-1 or VCAM-1 on the dish surface. Box-and-whisker plots of the (B) work of detachment, (C) detachment distance and detachment time, and (D) detachment force of THP-1 cell adhesion to VCAM-1 and ICAM-1, with and without co-immobilized MCP-1. The number in parenthesis above the plots corresponds to the number of cells studied. Numbers above each horizontal line represent the p-value from Mann-Whitney tests between respective measurement conditions. AFM measurements were acquired with a scan speed of ∼3 µm/s and a dwell time of 100 ms between approach and retract traces.

