
Figure 3. Single molecule measurements of the α4β1/VCAM-1 complex.
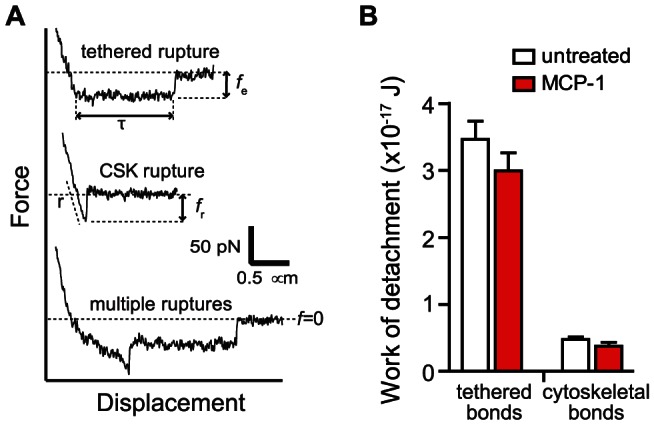
(A) Representative force-distance curves were acquired during cantilever retraction (∼3 µm/s) following a contact time of 100 ms. (Top Trace) Single tethered rupture event. Quantification of tether lifetimes (τ) and extraction forces (f e) are depicted. (Middle Trace) Single cytoskeleton anchored rupture event. Loading rates (r) were determined from the linear slope of the force-distance curve immediately prior to the rupture, as indicated by the dashed line. Rupture force (f r) is determined from the peak of the rupture event to zero force (horizontal dash line). (Bottom Trace) Measurements exhibiting multiple ruptures. (B) Work of detachment (mean ± s.e.m.) for single molecule adhesion of a cytoskeleton-anchored and membrane-tethered α4β1/VCAM-1 complex.