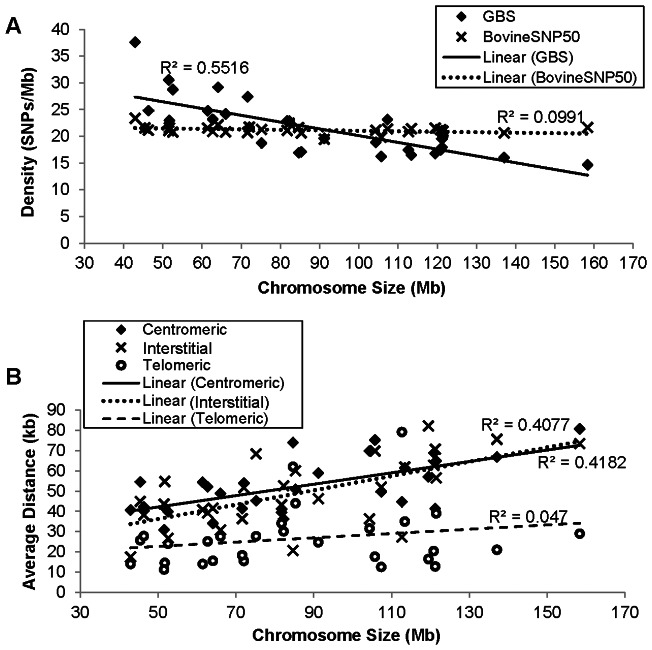
Figure 3. Distribution of SNPs according to chromosome size and chromosome region.
(A) Average marker density per chromosome related to its size for the SNPs from the GBS and from the Illumina BovineSNP50. (B) Average distances between adjacent GBS SNPs according to chromosomal region and length. The regional SNP distances were calculated averaging the contiguous SNPs distances in the corresponding one third of each chromosomal region. R2 is the Pearson regression coefficient.

