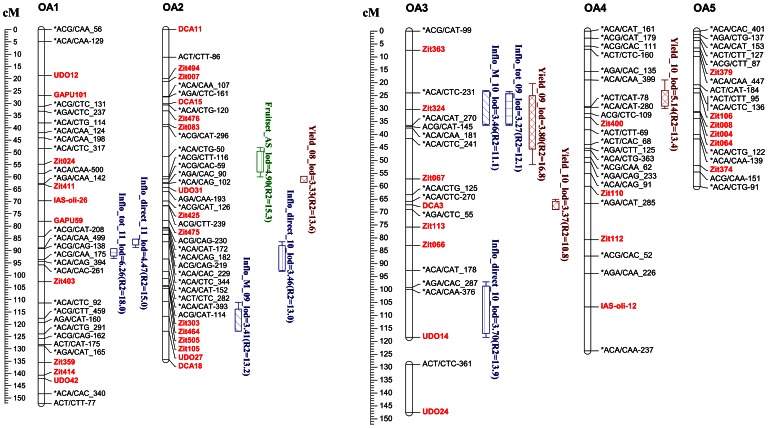
Figure 5. Genomic positions of the QTLs detected on the linkage groups of the ‘Olivière’בArbequina’ integrated map by multiple QTL mapping (MQM) for the best linear unbiased predictors (BLUPs) of reproductive traits measured at both tree and GUs scale.
Map distances were derived using the Kosambi mapping function and SSRs markers were colored in red. QTLs are represented by boxes extended by lines representing the LOD-1 and LOD-2 confidence intervals. Boxes are coloured according to the process of the traits: Blue and Green for flowering and fruiting at GUs scale, respectively; Brown for production at whole tree scale. For each trait, a distinct fill style was used for boxes representing QTLs. For each QTL, corresponding BLUP (computed from genotype effect or from the interaction between genotype and year), LOD peak and R2 were indicated as detailed in Table 6.

