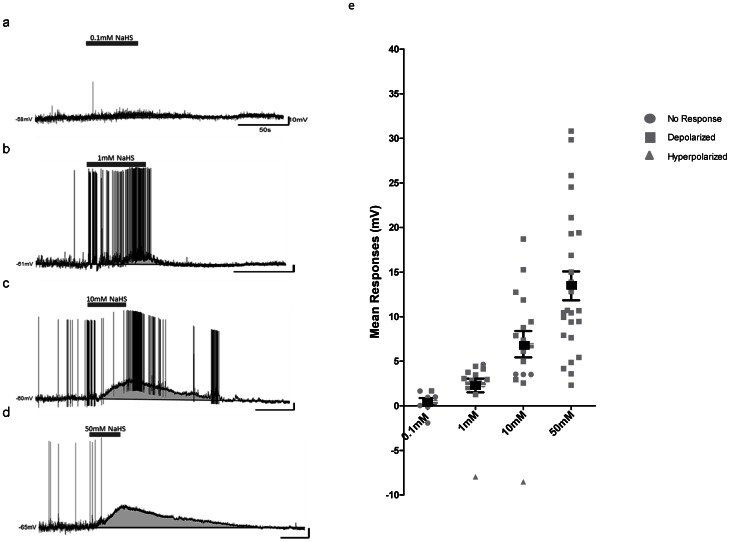
Figure 3. Hydrogen sulfide has a concentration dependent relationship.
Traces illustrate the magnitude of the depolarizations in response to the various NaHS concentrations (0.1, 1, 10, and 50 mM). As the concentrations increase so does the response. a) Current clamp recording trace illustrating no response to 0.1 mM NaHS. b) Current clamp recording trace illustrating a depolarizing response to 1 mM NaHS. c) Current clamp recording trace illustrating a depolarizing response to 10 mM NaHS. d) Current clamp recording trace illustrating a depolarizing response to 50 mM NaHS, with an increase in firing frequency during the initial phase of the depolarization. e) Scatter plot showing the response of all recorded neurons to the various NaHS concentrations (0.1, 1, 10, and 50 mM) with the mean response and standard deviations indicated by the black square and bars.

