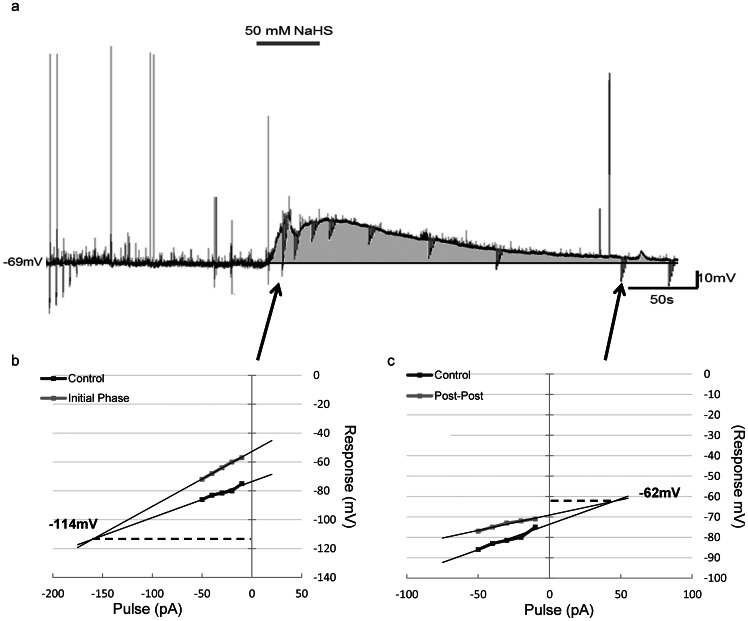
Figure 4. Hydrogen sulfide-induced depolarization is biphasic.
a) Current clamp recording trace illustrating the change in input resistance over the duration of the hydrogen sulfide-induced depolarization (50 mM). b) V/I plot showing the change in input resistance (point of intercept, 114 mV), during the initial phase of the depolarization. c) V/I plot showing the change in input resistance (point of intercept, 62 mV), during the recovery phase of the depolarization. Input resistance calculated from the slope of the line.

