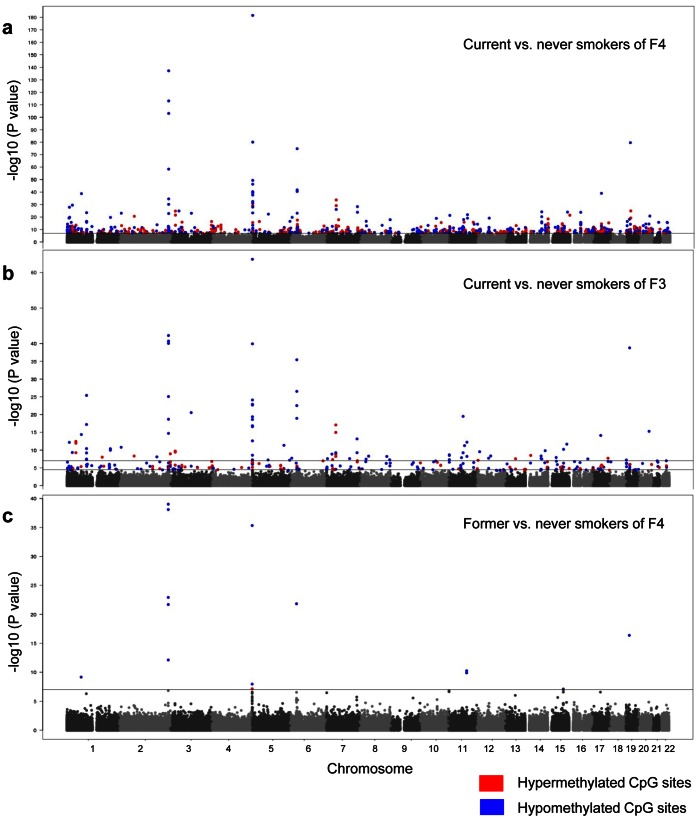
Figure 1. Genome-wide effect of current and former tobacco smoking on DNA methylation displayed by Manhattan Plots.
The continuous lines mark the 1E-07 significance thresholds, the lower line in Figure 1b marks the 5E-05. The significant CpG sites are color coded with the direction of the aberration in current/former smokers, using blue for hypomethylated and red for hypermethylated CpG sites. a) Current vs. never smokers of the F4 discovery panel; b) Current vs. never smokers of the F3 replication panel; c) Former vs. never smokers of the F4 discovery panel.

