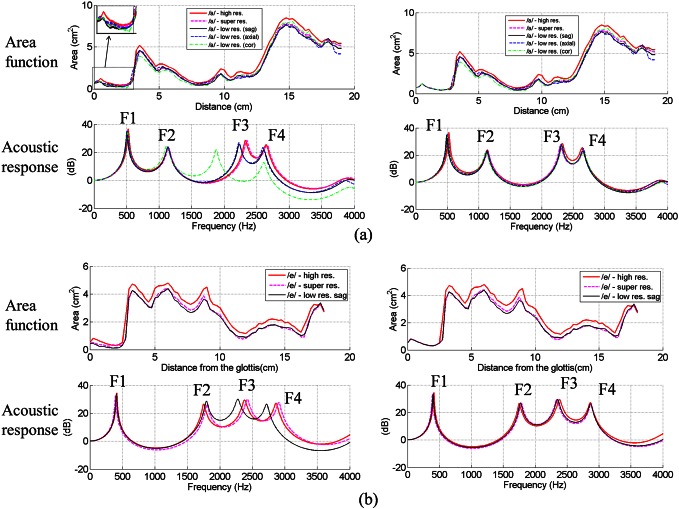
Figure 3.
(Color online) Area functions of /a/ and /e/ and their corresponding acoustic responses. (a) /a/ and (b) /e/. Right side: Area functions are extracted from MR data, and the left side: Area functions are the same as the left side, except that the pharynx regions are made the same as the ground truth, indicated by the thick solid line.

