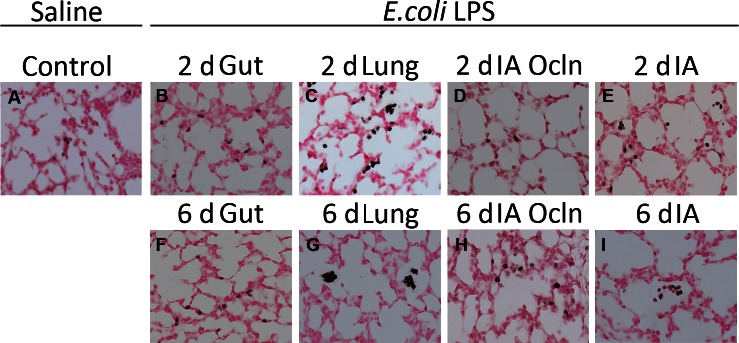
Figure 2. LPS infusion in the lung or the amniotic fluid induced myeloperoxidase (MPO) expression in the lung.

Representative photomicrographs are shown for MPO immunostaining in saline control exposed lung (A), 2d (B) and 6d (F) “Gut”, 2d (C) and 6d (G) “Lung”, 2d (D) and 6d (H) “IA Ocln” and 2d (E) and 6d (I) “IA” groups. All images 20×magnification. The immunostained inflammatory cells (exhibiting dark brown staining) were increased in the 2d and 6d “Lung”, 2d “IA” LPS and 2d “Gut” group, relative to controls (see quantitative counts of MPO positive cells in all the groups in Table 4).
