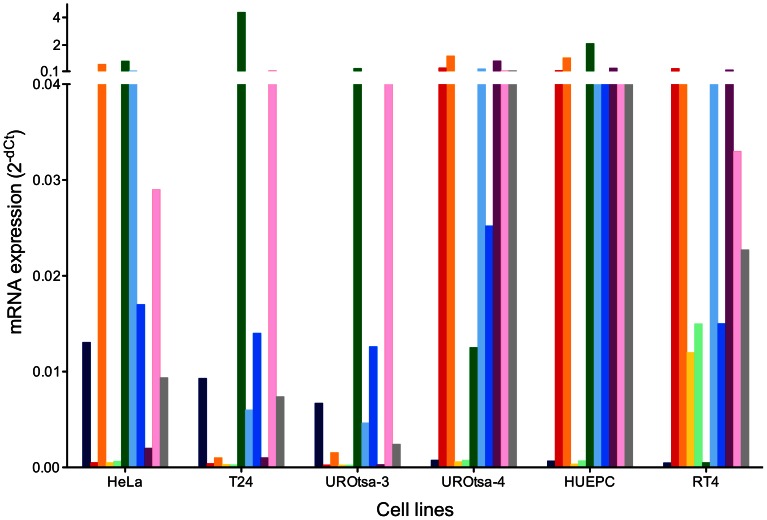
Figure 2. Comparison of mRNA expression in different cell lines and UROtsa stocks.
Normalized mRNA levels of ZEB1 (dark blue), CDH1 (red), KRT17 (orange), KRT20 (yellow), UPK1A (light green), VIM (green), TP53 (light blue), RB1 (blue), TP63 (purple), HRAS (pink), and NOTCH1 (grey) were determined in HeLa, T24, UROtsa-3/T24, UROtsa-4, primary urothelial cells (HUEPC), and RT4. Expression levels were determined by Real-Time PCR. GAPDH mRNA was used for normalization. Ct values >35 were considered as not detectable, usually resulting in 2−dCT values below 0.001. The y axis was adapted to better accommodate the genes with low expression levels. Original data can be found in Table S1.

