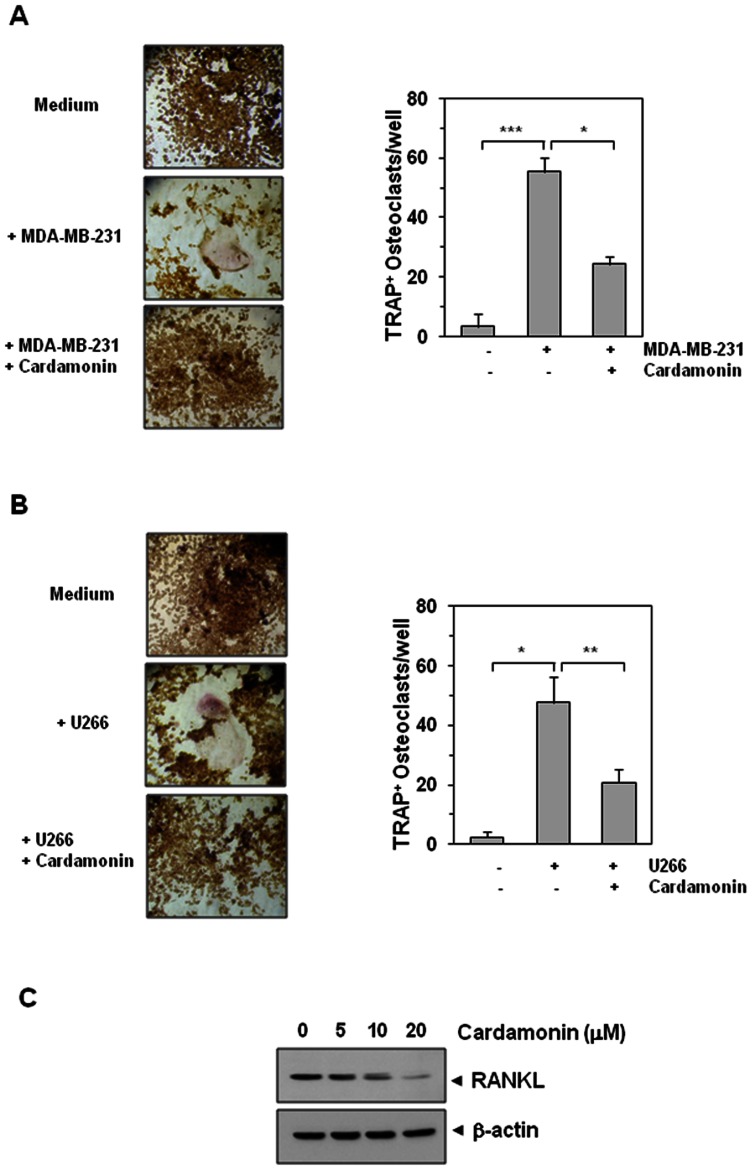
Figure 6. Cardamonin suppresses osteoclastogenesis induced by tumor cells.
(A) RAW 264.7 cells (5×10³/well) were incubated in the presence of MDA-MB-231 cells (1×10³/well) and exposed to cardamonin (500 nM) for 5 days, and finally stained for TRAP expression. Multinucleated osteoclasts were counted (right panel). Values represent means ± SD. Data are representative of two independent experiments performed in triplicates; *, P<0.05, and ***, P<0.001. (B) RAW264.7 cells (5×10³/well) were incubated in the presence of U266 cells (1×10³/well) and exposed to cardamonin (500 nM) for 5 days, and finally stained for TRAP expression. Multinucleated osteoclasts were counted (right panel). Values represent means ± SD. Data are representative of two independent experiments performed in triplicates; *, P<0.05, and **, P<0.01. (C) U266 cells (1×10⁶/well) were incubated with indicated concentration of cardamonin for 24 h. Whole cell extracts were prepared and analyzed by western blotting using RANKL antibody. Anti−β-actin was used as a loading control.

