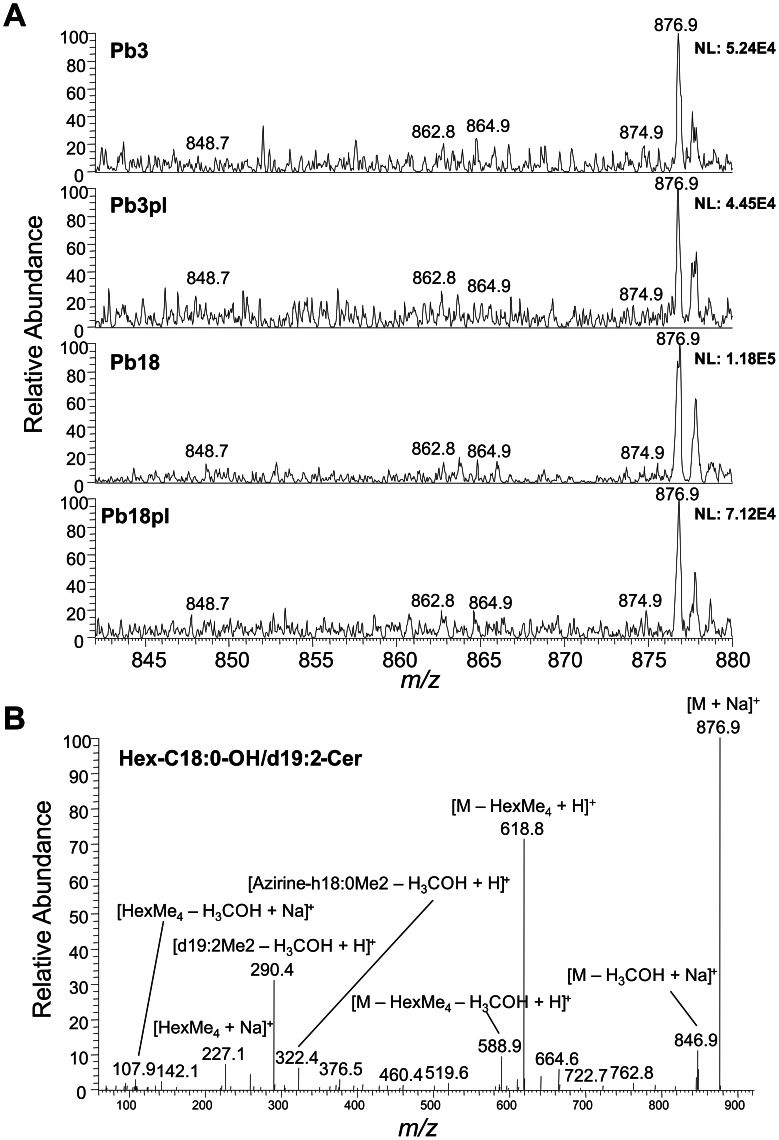
Figure 5. ESI-MS analysis of cell wall neutral glycolipids from Pb3 and Pb18 cultivated in the presence (pl) or absence of plasma.
A, Full-scan spectra in the positive-ion mode show the identified glycolipids Hex-C16∶0-OH/d19∶2-Cer (m/z 848.7), Hex-C18∶0-OH/d18∶2-Cer (m/z 862.8), Hex-C18∶0-OH/d18∶1-Cer (m/z 864.9), Hex-C18∶1-OH/d19∶2-Cer (m/z 874.9), and Hex-C18∶0-OH/d19∶2-Cer (m/z 876.9). B, Tandem-MS spectrum of the major glycolipid species identified (m/z 876.9). m/z, mass to charge ratio.

