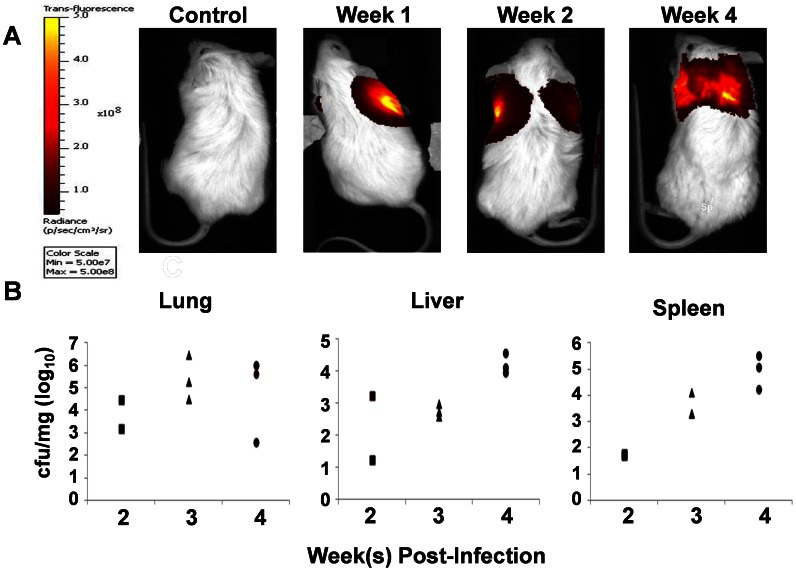
Figure 3. Progression of M.tb infection in humanized BLT mice.
Animals were infected i.n. with CFU tdTomato H37RV M.tb and in-vivo imaging (IVIS) performed at weekly time points. Shown in A is the fluorescent intensity signal from a group of animals infected with 106 CFU represented with a pseudocolor scale ranging from yellow (most intense) to dark red (least intense) and IVIS images of BLT mice; across: non-infected control mouse and M.tb infected BLT mice at 1, 2, and 4 weeks p.i. B, bacterial burden (CFU) are shown per milligram (mg) of tissue from individual animals (n = 3 per time point) at 2, 3, and 4 weeks p.i.

