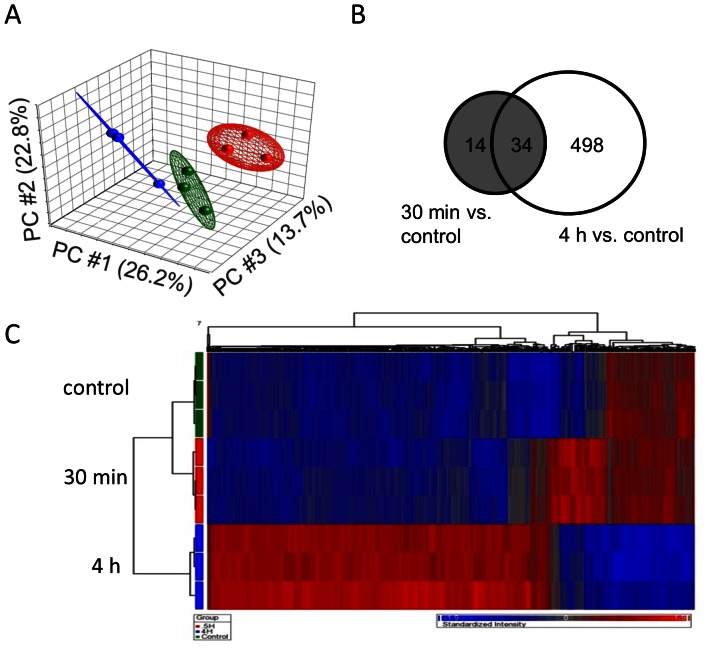
Figure 1. PKC activation-induced gene expression profiles.
(A) PCA analysis clearly separates the three groups: control (red), 0.5 hours of PDBu stimulation (blue), and 4 hours of PDBu stimulation (green). (B) Venn diagram shows the differentially regulated genes between the two time points. (C) Hierarchical clustering analysis clustering analysis of differentially expressed genes automatically segregated the three groups, and most of the genes were up-regulated by PKC activation.

