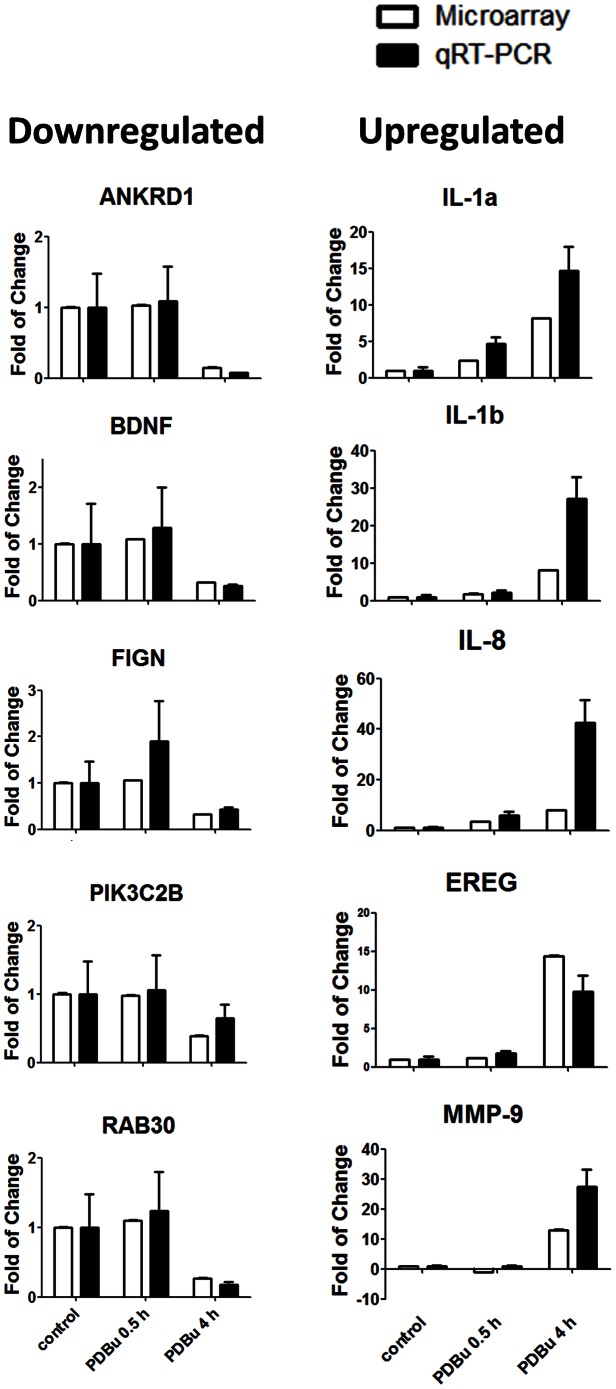
Figure 2. Validating microarray results with quantitative RT-PCR analysis.
Five down-regulated (ANKRD1, BDNF, FIGN, PIK3C2B, and RAB30) and five up-regulated genes (EREG, IL-1a, IL-1b, IL-8, MMP-8) were selected from the microarray data and their expression was examined with qRT-PCR. The trends of which the genes are up and down-regulated are similar between microarray and qRT-PCR results. The PCR results were normalized to a housekeeping gene, SDHA.

