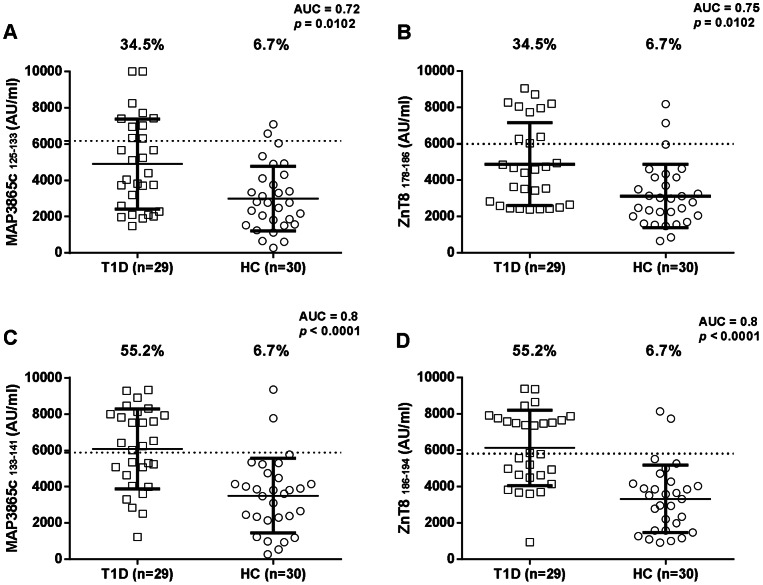
Figure 1. Prevalence of Abs against homologous ZnT8 and MAP3865c transmembrane epitopes in Type 1 Diabetes (T1D), and healthy controls (HCs) Sardinian children.
Sera were tested for their reactivity against plate-coated with MAP3865c125–133(A) and its homologous ZnT8178–186 (B); and with MAP3865c133–141 (C) and its homologous ZnT8186–194 (D). The dotted line lines indicate the cut-off for positivity used in each assay, as calculated by ROC analysis. The percent fraction of Ab+ sera is indicated on top of each distribution, while bars indicate the corresponding median±interquartile range. AUC and p values are given in the top right corner. Figure shows representative experiments out of three performed.

