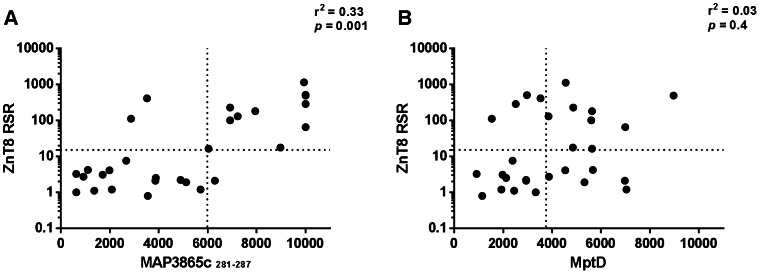
Figure 3. Correlation between titers of RSR ZnT8 Ab and MAP reactive Abs.

Correlation is shown between titers of Abs recognizing (A) ZnT8RSR Abs and MAP3865c281–287 C-terminal epitope; (B) ZnT8RSR Abs and MptD MAP specific protein. Each circle represents the titer of one T1D child. The dotted line lines indicate the cut-off for positivity used in each assay, as calculated by ROC analysis.
