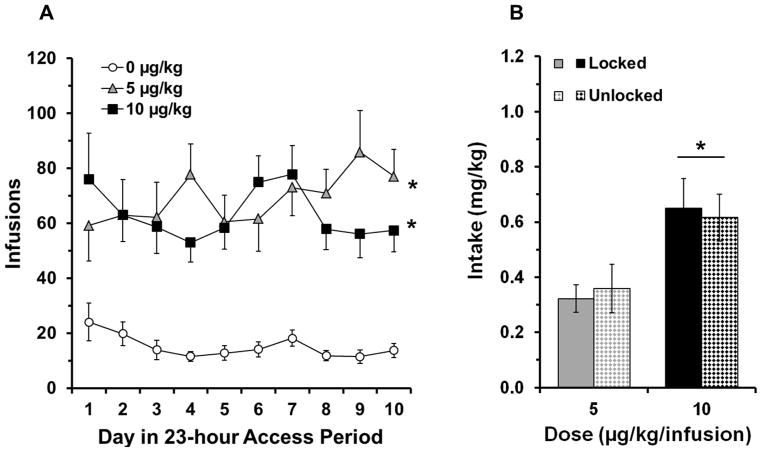
Fig 2.
Nicotine is reinforcing in adolescent rats. (a) Number of infusions (mean ± SEM) is plotted for each of the 10 days of extended access period. The open circles represent saline data points (n = 16), gray triangles represent the 5 μg/kg data points (n = 21), and black squares represent the 10 μg/kg data points (n = 18). An * indicates a significant difference from saline (p < 0.05). (b) Average daily intake during extended access (mean ± SEM) is plotted for all nicotine groups. Solid gray bar represents the locked wheel condition in the 5 μg/kg dose (n = 11), gray checkered bar represents the unlocked wheel condition in the 5 μg/kg dose (n = 10), black solid bar represents the locked wheel condition in the 10 μg/kg dose (n = 9) and black checkered bar represents the unlocked wheel condition in the 10 μg/kg dose (n = 9). The bar and * indicates a significant effect of dose (p < 0.05)

