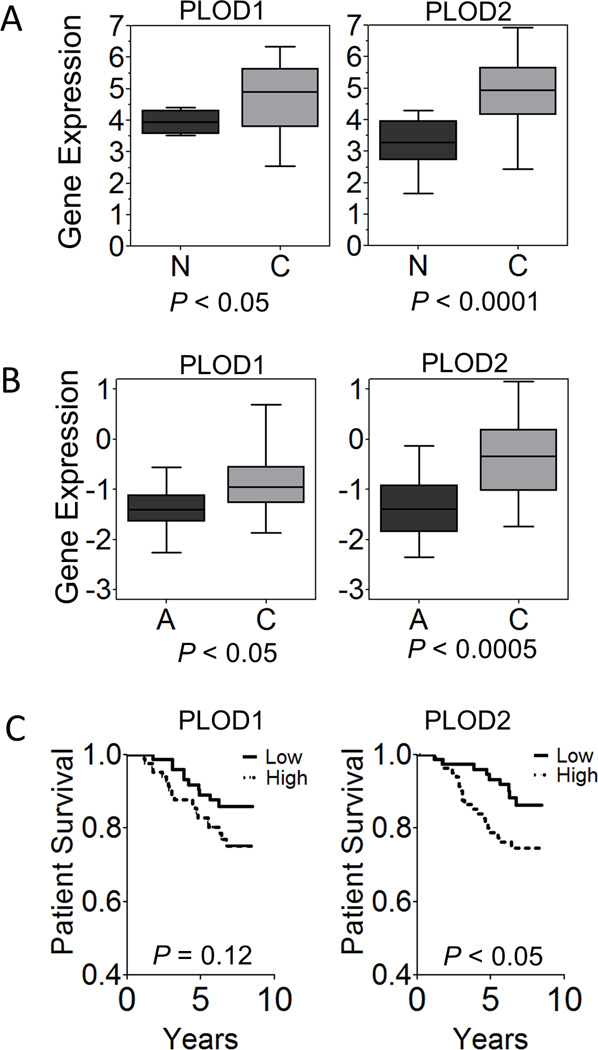
Figure 2.
PLOD1 and PLOD2 expression in breast cancer patients. A-B, PLOD1 and PLOD2 gene expression levels (presented as normalized microarray intensity values) in normal breast (n = 7) and breast cancer (n = 40) tissues (A) or in paired adjacent normal and breast cancer tissues from The Cancer Genome Atlas (n = 28) (B) are shown. The box represents the 25th through 75th percentiles and whiskers represent the minimum and maximum range of the data. P values were determined by Student’s t test. C, Kaplan-Meier analysis of disease-specific survival of 159 breast cancer patients stratified by PLOD1 (left) or PLOD2 (right) mRNA expression above the median level (High) or below the median level (Low).

