Figure 5.
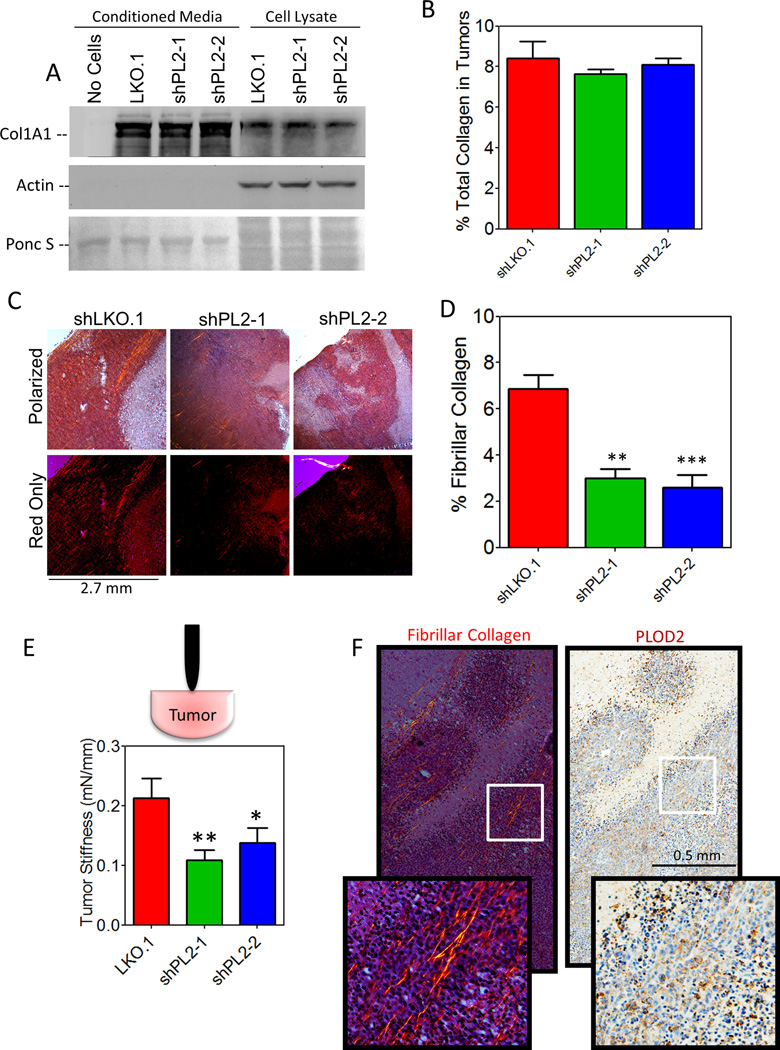
PLOD2 expression decreases fibrillar collagen formation but not total collagen deposition. A, collagen 1A1 protein levels in conditioned media and cell lysate of MDA-MB-231 subclones exposed to 1% O2 for 72 hours were determined by immunoblot assay. Actin was used as a loading control for cell lysate. Ponceau S staining was used as a loading control for conditioned media. B, collagen content of tumors was determined using the collagen hydroxyproline assay. C, tumor sections from the indicated subclones were stained with picrosirius red and imaged under circularly polarized light (top) and collagen fiber staining was thresholded and subjected to image analysis (bottom). D, picrosirius red staining of 3 sections from 5 mice per group was quantified by image analysis to determine the area of the tumor section occupied by collagen fibers (% fibrillar collagen; mean ± SEM, one-way ANOVA). E, the stiffness of freshly dissected control (shLKO.1) or shPLOD2 tumors was determined (mean ± SEM, one-way ANOVA). F, picrosirius red staining to detect crosslinked collagen fibers (left) and immunohistochemical staining to detect PLOD2 (right) were performed on serial control tumor sections. Bonferroni post-test was performed for all ANOVAs. *P<0.05, **P < 0.01, ***P < 0.001 vs. shLKO.1 in panels D and E.

