
Figure 3.
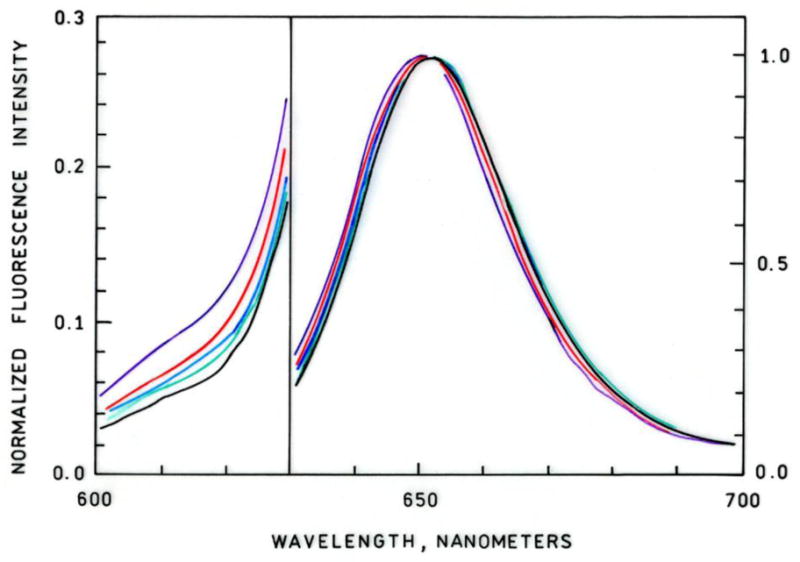
Zinc-dependent normalized fluorescence emission spectra of apo-H36C-AF594 CA plus Chesapeake Blue sulfonamide. From top to bottom at 610 nm, [Zn2+]FREE = 0.2, 1.06, 10.7, 55, 2000 pM. Note change in Y-axis scale at 630 nm; excitation at 590 nm.