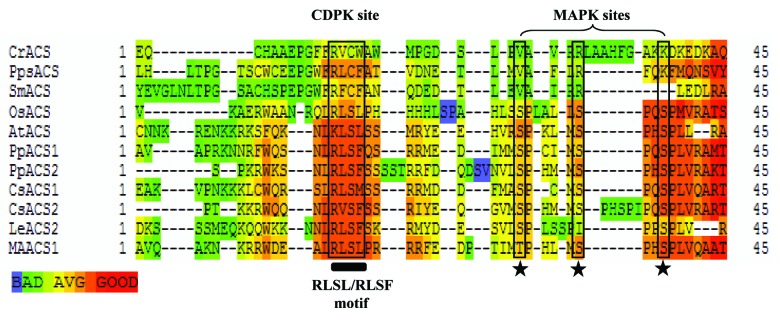
Figure 1. Comparison of C-terminal region of Type I ACC synthase proteins (reported and predicted) from different plant species. In silico analyses was performed using by using T-COFFEE server for comparative analysis of the C-terminal sequence of type I ACS proteins from diverse plant genomes. Cr (Chlamydomonas reinhardtii, v5.3 gene-g7098), Pps (Physcomitrella patens, gene-Pp1s235_83V6), Sm (Selaginella moellendorffii, gene-75495), Os (Oryza sativa, gene-LOC_Os04 g48850), At (Arabidopsis thaliana, gene-AT3G61510), Pp1 and Pp2 (Prunus persica, gene-ppa016458 min.g and ppa004774 min.g), Cs (Citrus sinensis, gene-orange1.1g011570 min.g and 1.1g011801 min.g), Le (Solanum lycopersicum, gene-NM_001247249), MA (Musa acuminata, gene-AY702076). The putative “RLSF/RLSL” motif (CDPK site, (within the box, indicated by bold black line) and the three Ser residues after the “RLSF/RLSL” motif (MAPK sites indicated by asterisk symbol) have been represented.
