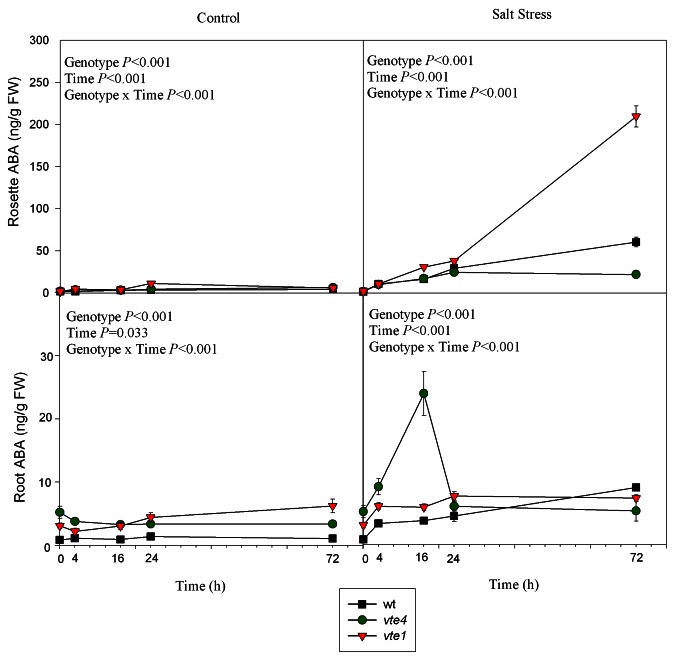
Figure 4. Time course evolution of ABA levels in leaves and roots of wild type and vte1 and vte4 mutants of A. thaliana growing in a hydroponic system exposed to control or salt stress conditions for 72h. Data are the mean ± SE of n = 4 replicates. Results of statistics are given in the panels (ANOVA, P ≤ 0.05). NS, not significant.

An official website of the United States government
Here's how you know
Official websites use .gov
A
.gov website belongs to an official
government organization in the United States.
Secure .gov websites use HTTPS
A lock (
) or https:// means you've safely
connected to the .gov website. Share sensitive
information only on official, secure websites.
