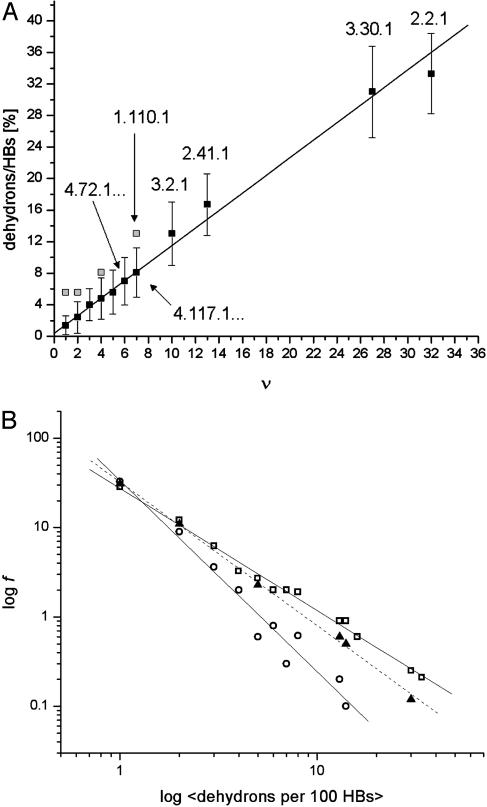
Fig. 3.
(A) Correlation between the average dehydron ratio and the connectivity ν of scop families represented in the PDB. Of the 831 families interrogated, many share identical ( , ν) points, albeit with different r dispersions. The error bars on the ordinates represent the dispersion in the r ratios across all members of each family subsequently averaged over all families sharing the same (
 , ν) point. The connectivities of families marked by solid squares were determined by examining PDB complexes where at least one domain belongs to the family, and independently from a nonstructural database (pfam). The gray squares denote families with a well determined r ratio but whose connectivity is underreported in the PDB. They are located on the correlation line once their connectivity is independently determined from a nonstructural database (pfam). The most interactive such family, with 8% dehydrons, is 1.115.1 whose PDB ν value is 4, but an independent nonstructural assessment using pfam gives ν = 7. (B) scop families distributed according to their average ratio
  of dehydrons per 100 hydrogen bonds (HBs). The quantity f = f(
 ), with f = fraction of total number of families, gives the distribution here plotted in log–log scale. □, H. sapiens; ▴, M. musculus; ○, E. coli.

