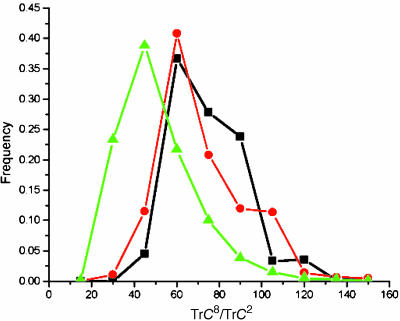
Fig. 2.
Distribution of eight-order normalized contact trace in evolved (black and red curves) and random (green curves) ensembles. Random ensemble consists of 3,000 randomly collapsed 36-mers. Red lines correspond to the structures that evolved in the first run of the evolutionary algorithm; black curves correspond to control evolutionary run, which used another set of parameters (21). The data for these histograms are binned into bins of size 15. To account for the effect of possible variation in contact density (TrC2) on higher-order trace due to correlation between them (see Figs. 5- 8), here we normalized higher-order traces, both for random and evolved structures, by their contact densities.

