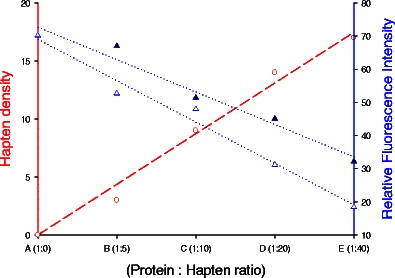
Fig. 2.

The correlation between hapten–protein conjugation density as determined by MALDI-TOF for different ratio of hapten–protein conjugates (circle with dashed line) and the relative fluorescence intensity for conjugates: a 2,4-D-protein conjugate (solid triangle with dotted line) and b atrazine–protein conjugate (empty triangle with dotted line)
