Fig. 1.
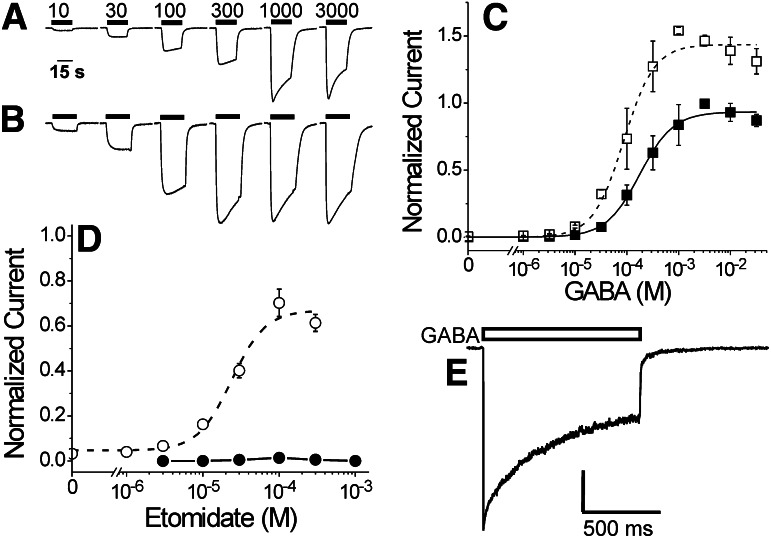
GABA activation and etomidate modulation of α1β2M286Cγ2L GABAA receptors. (A) Current traces are from a single Xenopus oocyte expressing α1β2M286Cγ2L receptors, activated with different GABA concentrations. GABA application (labeled in micromolar) is indicated by horizontal bars above traces. (B) Current traces are from the same oocyte in (A), stimulated with variable GABA (labeled in micromolar above trave in A) plus 3.2 μM etomidate. GABA and etomidate application is indicated by horizontal bars above traces. (C) Averaged (± S.D.; n ≥ 6) GABA responses in the absence (solid squares) and presence of etomidate (3.2 μM; open squares) are shown. Current responses were normalized to the 3 mM GABA response in the same oocyte before averaging data from all cells. Lines represent logistic fits (eq. 1, in Materials and Methods) to data. Fitted parameters for GABA alone (solid line) are EC50 = 180 ± 19 μM and Hill slope = 1.3 + 0.16. Fitted parameters for GABA plus etomidate (dashed line) are maximum = 1.44 + 0.04, EC50 = 87 ± 11, and Hill slope = 1.5 ± 0.24. Restricting analyses to data below 3 mM GABA does not alter the relative maxima or GABA EC50 values. (D) Average (± S.D.; n ≥ 3) responses to etomidate alone (solid circles and line) or to etomidate combined with 20 μM GABA (EC3; open circles). Currents were normalized to 3 mM GABA responses in the same oocyte before averaging. Etomidate direct activation was never greater than 1.5% of maximal GABA response and was not further analyzed. The dashed line through GABA EC3 enhancement data represents a logistic fit: maximum = 67 ± 5.0%, EC50 = 24 ± 4.9 μM, Hill slope = 2.0 ± 0.75. (E) A voltage-clamp current trace recorded from an outside-out patch excised from an HEK293 cell expressing α1β2M286Cγ2L receptors and activated with 3 mM GABA for 1 second (bar above trace) delivered with sub-millisecond solution switching. The trace displays rapid activation, biphasic desensitization, and biphasic deactivation. Average rates for each phase are reported in Table 1.

