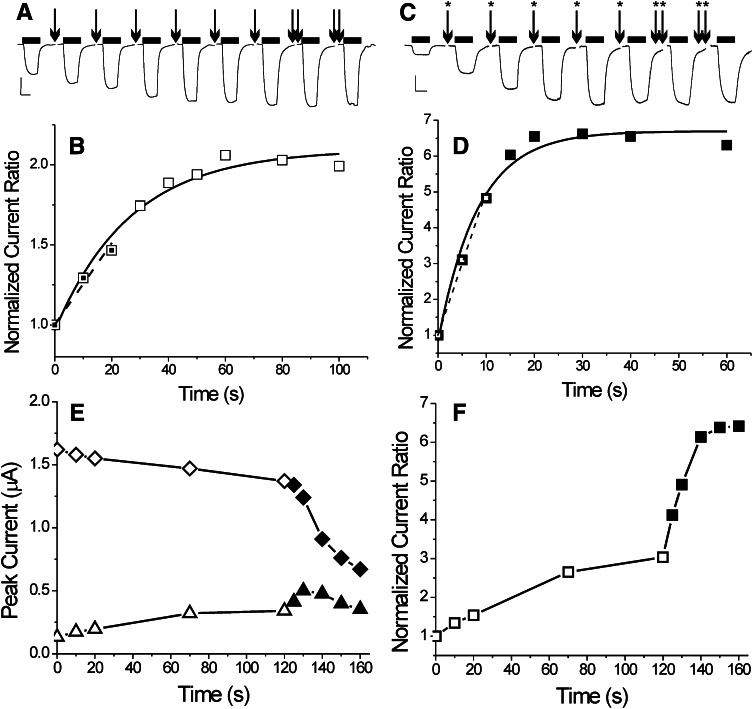
Fig. 3.
p-Chloromercuribenzene sulfonate modification of α1β2M286Cγ2L GABAA receptors is GABA dependent. (A) Traces represent currents recorded from a single oocyte expressing α1β2M286Cγ2L receptors, activated intermittently with 30 μM GABA (horizontal bars above each trace), each scaled to normalizing 2 mM GABA responses (not shown). Arrows indicate oocyte exposure to 50 μM pCMBS for 10 seconds (20 seconds for double arrows) followed by wash. The I30 μM approximately doubles relative to I2 mM after 60 seconds of pCMBS exposure. (B) Symbols represent the I30μM/I2mM ratios from (A) normalized to the initial value (t = 0), plotted against cumulative pCMBS exposure time. The solid line represents a single exponential fit to the data, characterized by an exponential time constant of 27 ± 4.5 seconds (apparent second-order reaction rate = 750 ± 130 M-1S−1). The dashed line is a linear fit to the first three data points. Its slope is 0.0255 second−1, resulting in an apparent initial reaction rate of 510 M-1s−1. (C) Current traces were recorded from another oocyte expressing α1β2M286Cγ2L receptors, activated intermittently with 30 μM and 2 mM GABA, each scaled to normalizing 2 mM GABA responses (not shown). Starred arrows represent coexposure to 50 μM pCMBS plus 2 mM GABA for 5 seconds (10 seconds for double-starred arrows) followed by wash. (D) Symbols represent I30 μM/I2 mM ratios from (C) normalized to the initial value (t = 0), plotted against cumulative exposure time. The I30 μM/I2 mM ratio increases more than 6-fold after 20 seconds of pCMBS/GABA exposure. A single exponential fit results in a time constant of 8.3 ± 1.2 seconds (apparent second-order reaction rate = 2400 ± 340 M-1s−1). A linear fit to the first three data points results in a slope of 0.454 second−1 (apparent initial rate = 9080 M-1s−1). (E) Symbols represent peak currents recorded from an oocyte expressing α1β2M286Cγ2L receptors activated with either 30 μM (triangles) or 2 mM (diamonds) GABA. The x-axis indicates cumulative exposure time to 50 μM pCMBS in the absence of GABA (open symbols, up to 120 seconds) and then in the presence of 50 μM pCMBS plus 2 mM GABA (solid symbols). (F) Symbols represent the I30 μM/I2 mM ratios from data in panel E, normalized to the initial value at t = 0 (0.08).

