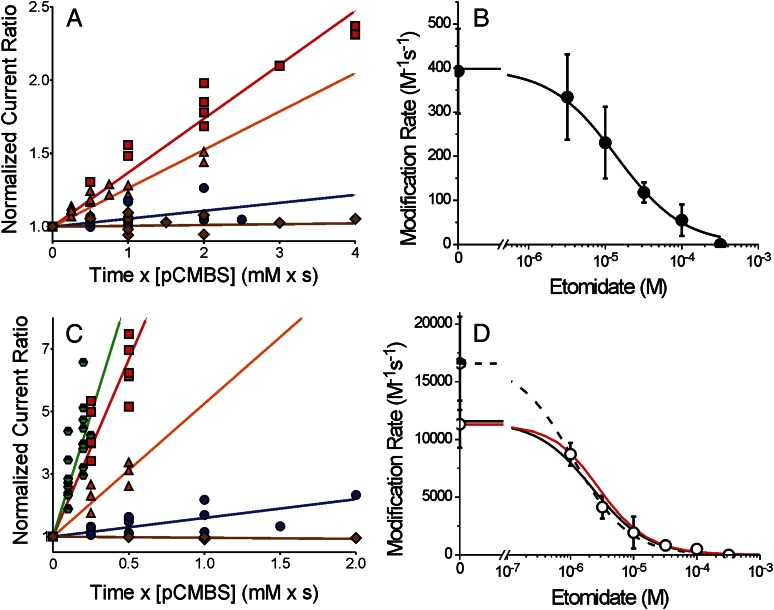
Fig. 4.
Etomidate inhibition of the β2M286C-pCMBS reaction is enhanced by GABA. (A) Symbols represent data from a subset of oocytes expressing α1β2M286Cγ2L receptors used to study etomidate’s effects on pCMBS modification in the absence of GABA. Normalized IloGABA/I2 mM is plotted against cumulative pCMBS exposure (concentration × time). Lines represent linear fits to all points in each data set: pCMBS alone = red squares (370 ± 14 M-1s−1; n = 6); pCMBS + 3 μM etomidate = orange triangles (260 ± 14 M-1s−1; n = 7); pCMBS + 30 μM etomidate = blue circles (54 ± 11 M-1s−1; n = 7); pCMBS + 300 μM etomidate = brown diamonds (6 ± 8.5 M-1s−1; n = 4). (B) Symbols represent the average (± S.D.) of initial rates of pCMBS modification in the absence of GABA, from individual oocyte results, plotted against etomidate. The line through data represents a logistic fit. Max = 400 ± 26 M-1s−1 and PC50 = 14.3 μM (95% CI = 7.5 to 27.2 μM). (C) Symbols represent data from a subset of oocytes expressing α1β2M286Cγ2L receptors used to study etomidate effects on pCMBS modification in the presence of 2 mM GABA or GABA plus 2 μM alphaxalone. Normalized IloGABA/I2 mM is plotted against cumulative pCMBS exposure (concentration × time). Lines represent linear fits to all points in each data set: GABA + pCMBS= red squares (11,300 ± 580 M-1s−1; n = 5); GABA + pCMBS + 3 μM etomidate = orange triangles (3500 ± 270 M-1s−1; n = 4); GABA + pCMBS + 30 μM etomidate = blue circles (600 ± 76 M-1s−1; n = 6); GABA + pCMBS + 300 μM etomidate = brown diamonds (−40 ± 11 M-1s−1; n = 3); GABA + alphaxalone = green half-filled hexagons (16,600 ± 960 M-1s−1; n = 8). (D) Open circles represent the average (± S.D.) of initial rates of pCMBS modification in the presence of GABA, from individual oocyte results, plotted against etomidate. The solid line through data represents a logistic fit: max = 11,300 ± 490 M-1s−1 and PC50 = 2.2 μM (95% CI = 1.5 to 3.1 μM). The dashed line represents a logistic fit using the GABA + alphaxalone control: max = 16,600 ± 890 M-1s−1 and PC50 = 1.1 μM (95% CI = 0.65 to 1.9 μM). The red solid line represents a theoretical protection profile calculated using the fitted MWC model parameters for α1β2M286Cγ2L (Table 1). Open probability was calculated as a function of etomidate at GABA = 2 mM, protection was calculated using the predicted open-state etomidate dissociation constant (KE × d ≈ 1.4 μM), and a Hill slope of 1.0; control modification rate was set at the experimentally observed value (11,300 M-1s−1).

