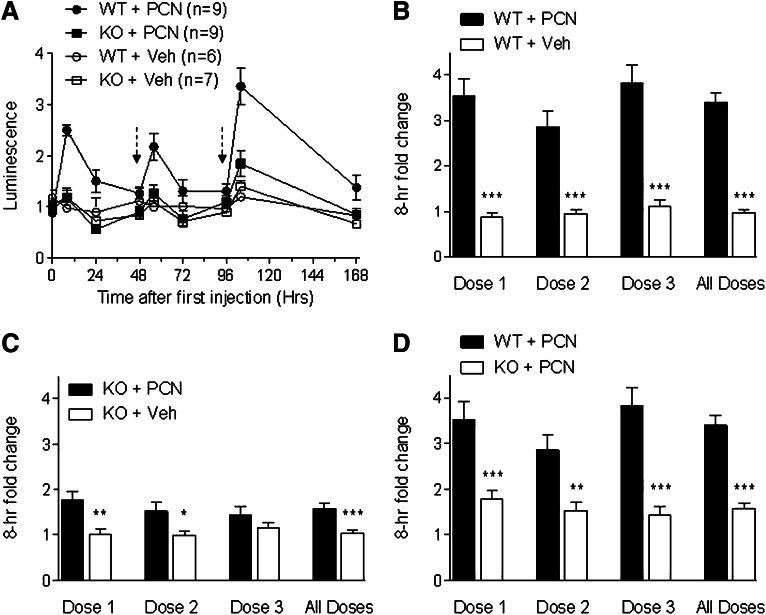
Fig. 1.
Dynamic induction of mdr1a.fLUC by multiple doses of PCN. (A) pxr+/+ (WT) and pxr−/− (KO) mice that were heterozygous for mdr1a.fLuc allele were given PCN (200 mg/kg) or the same volume of vehicle control (Veh) by i.p. injection at time 0 and at 48 and 96 hours after the initial PCN treatment as indicated by the dashed arrows. Results are from a single representative experiment. Mdr1a.fLUC expression was quantified by measuring luminescence intensity in the abdominal area at various time points before and after PCN or vehicle injection. The luminescence intensity for each animal at each time point was normalized to the average baseline (t = 0) luminescence intensity for the entire group of mice of the same genotype within a given experiment. Each data point represents the average (± S.E.M.) normalized intensities for the respective genotypes and treatment groups at each time point.. (B–D) Normalized luminescence intensities at the 8-hour time points after each dosing cycle. Data from all mice from three multi-dosing experiments are pooled and averaged (± S.E.M.). (B) shows the comparison between WT mice treated with PCN and WT mice treated with Veh. (C) shows the comparison between KO mice treated with PCN and KO mice treated with Veh. (D) shows the comparison between WT mice treated with PCN and KO mice treated with PCN. In the All Doses columns, data from all mice from all experiments and all dosings are averaged. WT + PCN (n = 27), KO + PCN (n = 27), WT + Veh (n = 15), KO + Veh (n = 16). *P ≤ 0.05; **P ≤ 0.01; ***P ≤ 0.001.

