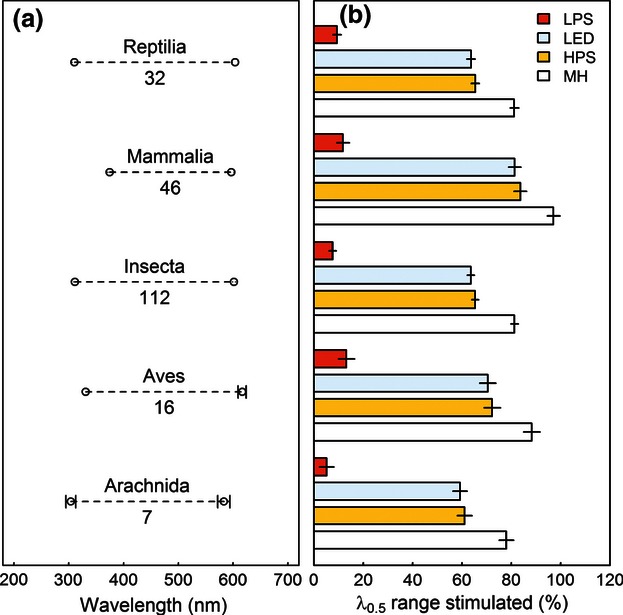
Fig. 2.

The percentage of the visual range stimulated by four contrasting street lighting technologies in five classes of animal. (a) The λ0.5 range of animals estimated for five classes. The average minimum and maximum wavelengths of half maximum visual pigment absorbance are denoted by points with error bars representing 95% credibility intervals estimated using MCMC regression. Values quoted under dashed lines represent the number of species on which derived values are based. (b) The percentage of the visual range at more than half maximum absorbance stimulated by each street light in each of five classes of animal. Means and 95% credibility intervals (error bars) were estimated using MCMC regression.
