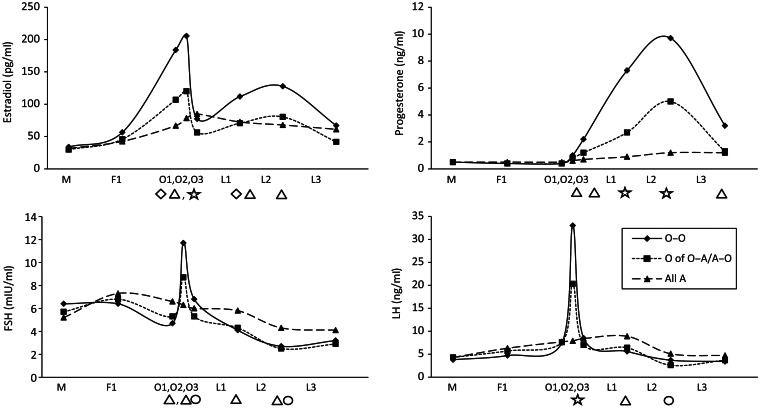
Figure 1.
Geometric mean hormone levels among women in the biocycle study by cycle phase and ovulatory status after adjustment for age and BMI. A, anovulatory cycle; BMI, body mass index; FSH, follicle-stimulating hormone; LH, luteinizing hormone; O, ovulatory cycle. Symbols indicate significant differences (P < 0.05) between cycle types within each hormone and each visit, adjusted for each multiple comparisons via the Bonferroni method. Diamond: O–O different from O; Triangle: O–O different from all A; Circle: O different from all A; Star: all pairwise significant. O–O includes cycles of women with two ovulatory cycles (n = 438 cycles); O of O–A/A–O includes the ovulatory cycles only of women with one ovulatory and one anovulatory cycle (n = 24 cycles), all A includes all anovulatory cycles from women with two anovulatory cycles A–A, and the anovulatory cycle of women with one ovulatory and one anovulatory cycle A of O–A/A–O (n = 38 cycles).

