
Fig. 3.
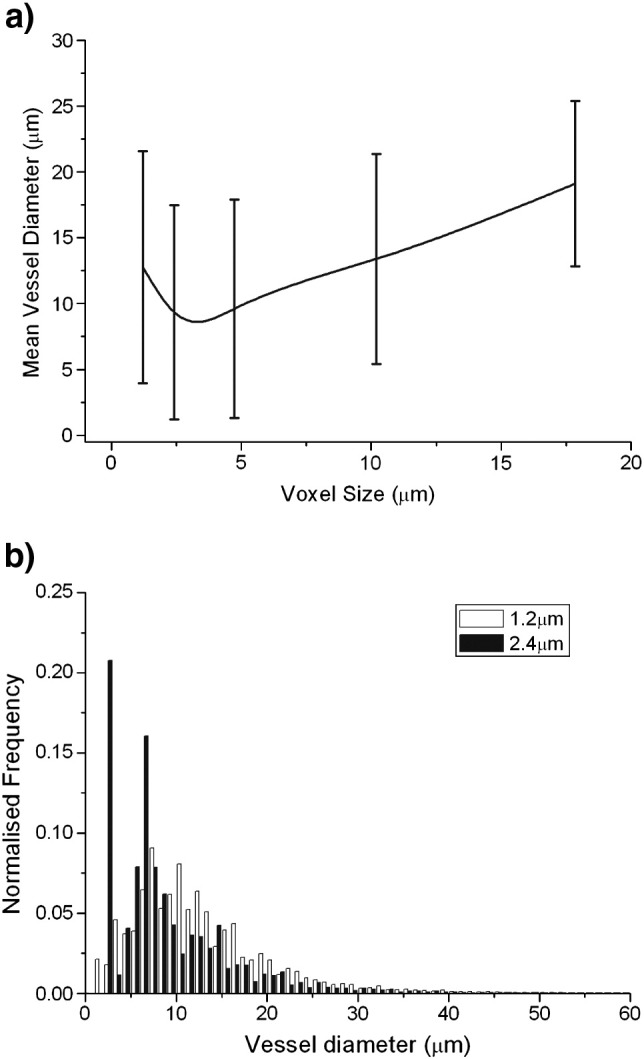
(a) Variation of mean vessel diameter with voxel size of the tomography data. The error bars show the standard deviations calculated from the vessel diameter distributions, and (b) comparison of the distribution of vessel diameters for a voxel size of 1.2 and 2.4 μm.