
FIG. 4.
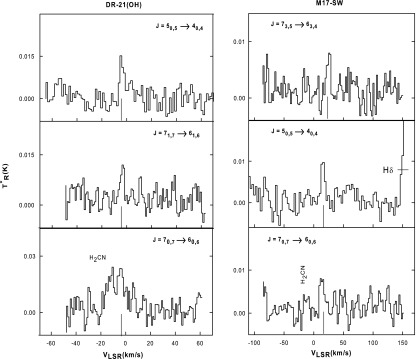
Example spectra of formamide transitions observed toward DR21(OH) (left panels) and M17 SW (right panels) at 3 and 2 mm with the ARO 12 m telescope. The spectral resolution is 500 kHz. The quantum numbers for each transition are shown on each panel. The vertical line under each spectrum indicates the cloud average LSR velocity: −3 km/s for DR21(OH) and 18 km/s for M17 SW.