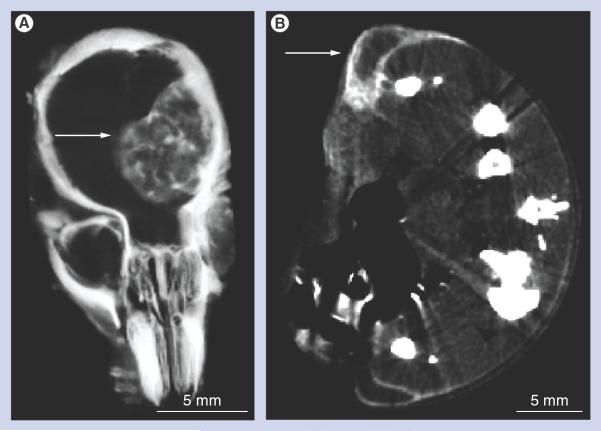
Figure 4. Microcomputed tomography sections comparing glioma versus subcutaneous tumor gold nanoparticle distribution after intravenous injection.
Thin microcomputed tomography sections through the center of tumors of live mice bearing (A) an orthotopic brain tumor or (B) two subcutaneous tumors, one on each leg, see arrows. (A) Note how the gold nanoparticles (white contrast) are distributed throughout the brain tumor, even in its center, whereas (B) the subcutaneous tumors have gold nanoparticles predominantly at their periphery.

