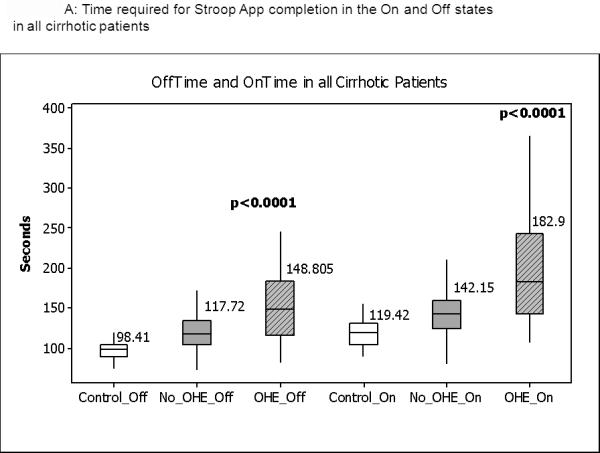
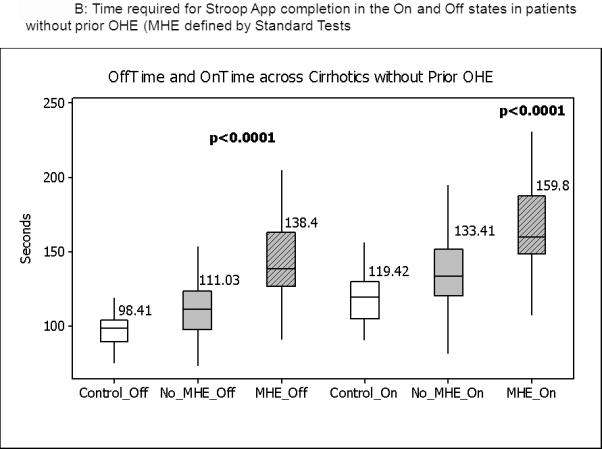
Figure 1.


Median and IQR of time required to complete the App in the “Off” and “On” states. Figure 1A shows the distribution of values in the entire group in which control values are compared to cirrhotics without prior OHE and those with prior OHE. Figure 1B shows the comparison between controls and cirrhotics with MHE and no MHE based on standard tests. No_OHE: no prior overt hepatic encephalopathy, OHE: prior overt HE, No_MHE: no MHE and MHE: minimal hepatic encephalopathy. All comparisons were highly statistically significant
