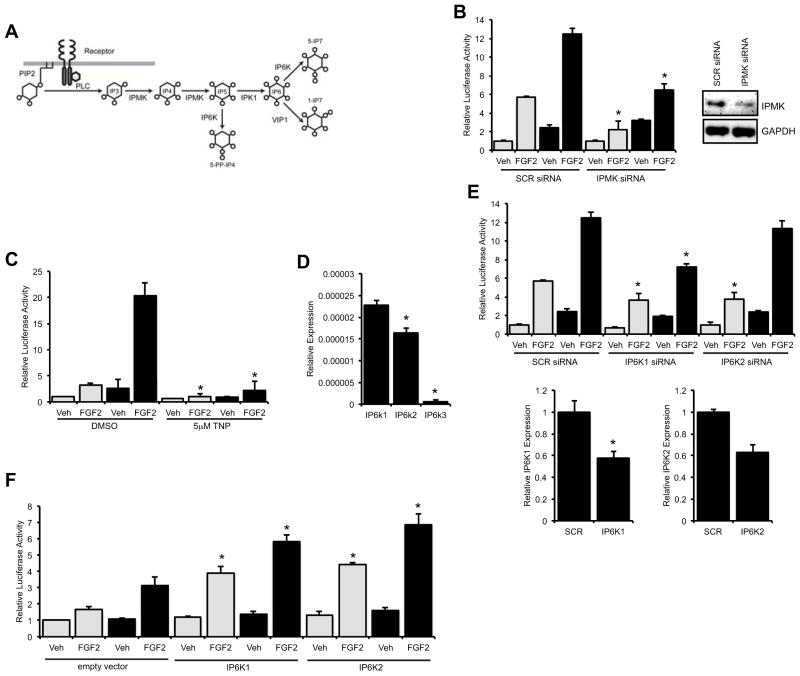
Fig. 3.
Involvement of higher order inositol polyphosphates in the Cx43-dependent potentiation of Runx2 activity. (A) A schematic of the pathway by which PLC activity can yield higher order inositol polyphosphates and inositol pyrophosphates. (B) Luciferase reporter assays were performed on cells co-transfected with p6xOSE2-Luc and pSFFV-neo empty vector (grey bars) or pSFFV-Cx43 expression vector (black bars) and scrambled siRNA (SCR, 50nM) or IPMK siRNA (IPMK, 50nM) and then treated with vehicle (Veh) or FGF2 (10ng/ml, 4h). Inset, western blot of whole cell extracts from cells transfected with scrambled or IPMK targeted siRNA probed with anti-IPMK and anti-GAPDH antibodies. (C) Luciferase reporter assays were performed as above in cells treated with vehicle (Veh) or FGF2 (10ng/ml, 4h) in the presence or absence of the IP6K inhibitor TNP (5μM). (D) Quantitative real time RT-PCR of IP6K1, IP6K2 and IP6K3 in confluent cultures of MC3T3 cells. (E) Luciferase reporter assays were performed as above in cells treated with 50nM scrambled siRNA, IP6K1 siRNA or IP6K2 siRNA. Quantitative real time RT-PCR (IP6K1 and IP6K2 primers, respectively) of cells transfected with 50nM scrambled siRNA, IP6K1 siRNA or IP6K2 siRNA. For luciferase assay graphs, cells transfected with pSFFV-neo empty vector are shown with grey bars, cells transfected with pSFFV-Cx43 expression vector are shown with black bars. (F) Luciferase reporter assays were performed on cells co-transfected with p6xOSE2-Luc and pSFFV-neo empty vector (grey bars) or pSFFV-Cx43 expression vector (black bars) along with a IP6K1 expression vector, IP6K2 expression vector or an empty vector and treated with vehicle (Veh) or FGF2 (10ng/ml, 4h), as above. For all luciferase assay graphs, cells transfected with pSFFV-neo empty vector are shown with grey bars, cells transfected with pSFFV-Cx43 expression vector are shown with black bars. Graphs depict means + s.d. for a representative experiment performed in triplicate wells, n = 3. For real time PCR, * p-value < 0.05. For luciferase reporter assays, * p-value < 0.05 relative to the corresponding FGF2-treated control.

