Fig. 5.
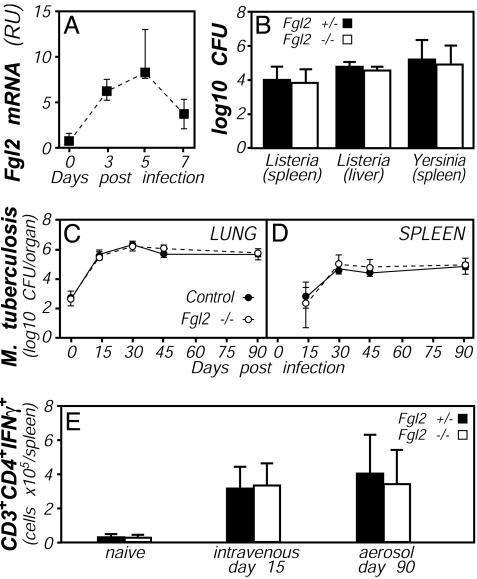
Bacterial responses in Fgl2-deficient mice. (A) Up-regulation of Fgl2 expression during bacterial infection. WT C57BL/6 mice were i.p. infected with 1 × 10⁵ L. monocytogenes, and levels of Fgl2 mRNA levels were quantified by real-time PCR. (B) Similar bacterial burdens in Fgl2-deficient (open bars) and control heterozygous mice (filled bars) after bacterial infection. Colony-forming units in the indicated organs were determined at day 5 after i.p. infection with 1 × 10⁵ L. monocytogenes or i.v. infection with 5 × 10³ Y. enterocolitica. In each case, data depict average and standard deviation of five mice per group, and no statistically significant differences were observed. (C-E) Similar bacterial burdens and T cell responses in Fgl2-deficient (open symbols) and control mice (filled symbols) after mycobacterial infection. CFUs in lung (C) or spleen (D) were determined on the indicated days after aerosol infection with M. tuberculosis. (E) Numbers of splenic CD3+CD4+ cells that could produce IFNγ on in vitro reactivation were quantified by flow cytometry 15 days after i.v. infection or 90 days after aerosol infection with M. tuberculosis. For C-E, data depict the average and standard deviation of four mice per group, except that only two Fgl2-deficient mice were analyzed at day 45.

