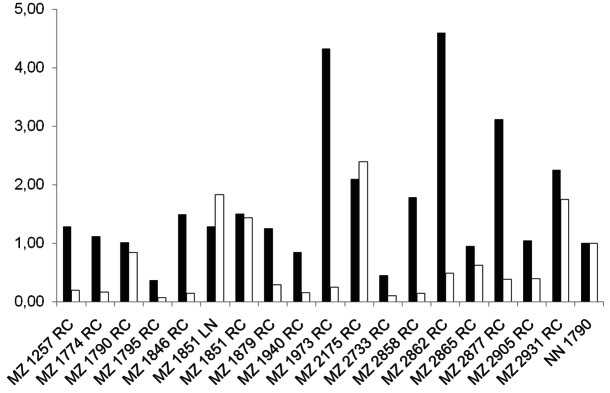
Figure 3.

Heterogeneous ERAP1 and ERAP2 expression in RCC cell lines. The constitutive mRNA expression levels of ERAP1 (black bars) and ERAP2 (white bars) were analysed in a panel of renal cell carcinoma cells lines as indicated on the x axes by qRT-PCR using ERAP1 and ERAP2-specific primers. The relative mRNA expression levels were normalized to GAPDH, which served as a control.
